
Advanced Search: Build a Custom Dashboard
In the fields below, search for indicators by location, topics, population, classification, subgroup, or comparison. No fields are required, but we suggest selecting a location or two to start. In the additional search options section, select options to group and order search results. To learn more about how to customize a dashboard, see our help center.
Visit the Indicator List Page to see the full list of indicators and locations available on the site.
Search Results:
Indicator Gauge Icon Legend
Legend Colors
Red is bad, green is good, blue is not statistically different/neutral.
Compared to Distribution
 the value is in the best half of communities.
 the value is in the 2nd worst quarter of communities.
 the value is in the worst quarter of communities.
Compared to Target
 meets target;
  does not meet target.
Compared to a Single Value
 lower than the comparison value;
 higher than the comparison value;
 not statistically different from comparison value.
Trend

 non-significant change over time;
 significant change over time;
  no change over time.
Compared to Prior Value
 higher than the previous measurement period;
 lower than the previous measurement period;
 no statistically different change from previous measurement period.
Health / Alcohol & Drug Use
Health / Alcohol & Drug Use
County: Ottawa
Value
Compared to:
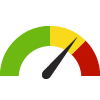
County: Ottawa Adults who Binge Drink
County: Ottawa Adults who Binge Drink
12.6%
(2021)
Compared to:
OK Counties
The distribution is based on data from 77 Oklahoma counties.
U.S. Counties
The distribution is based on data from 3,074 U.S. counties and county equivalents.
US Value
(15.5%)
The regional value is compared to the national value.
County: Ottawa Adults who Drink Excessively
County: Ottawa Adults who Drink Excessively
13.0%
(2021)
Compared to:
OK Counties
The distribution is based on data from 77 Oklahoma counties.
U.S. Counties
The distribution is based on data from 3,141 U.S. counties and county equivalents.
OK Value
(13.8%)
The regional value is compared to the Oklahoma State value.
US Value
(18.1%)
The regional value is compared to the national value.
Prior Value
(14.0%)
Prior Value compares a measured value with the previously measured value. Confidence intervals were taken into account in determining the direction of the comparison.
Trend
This comparison measures the indicator’s values over multiple time periods.<br>The Mann-Kendall Test for Statistical Significance is used to evaluate the trend<br>over 4 to 10 periods of measure, subject to data availability and comparability.
County: Ottawa Death Rate due to Drug Poisoning
County: Ottawa Death Rate due to Drug Poisoning
20.6
Deaths per 100,000 population
(2019-2021)
Compared to:

OK Counties
The distribution is based on data from 43 Oklahoma counties.
U.S. Counties
The distribution is based on data from 1,899 U.S. counties and county equivalents.
OK Value
(19.9)
The regional value is compared to the Oklahoma State value.
US Value
(27.2)
The regional value is compared to the national value.
HP 2030 Target
(20.7)
<div>SU-03: Reduce drug overdose deaths <strong>(LEADING HEALTH INDICATOR)</strong></div>
County: Ottawa Households that Received Substance Abuse Medical Services
County: Ottawa Households that Received Substance Abuse Medical Services
1.4%
(2023)
Compared to:


OK Value
(1.4%)
The regional value is compared to the Oklahoma State value.
US Value
(1.3%)
The regional value is compared to the national value.
Prior Value
(1.6%)
Prior Value compares a measured value with the previously measured value. Confidence intervals were not taken into account in determining the direction of the comparison.
Trend
This comparison measures the indicator’s values over multiple time periods.<br>The Mann-Kendall Test for Statistical Significance is used to evaluate the trend<br>over 4 to 10 periods of measure, subject to data availability and comparability.
Health / Cancer
Health / Cancer
County: Ottawa
Value
Compared to:
County: Ottawa Adults with Cancer
County: Ottawa Adults with Cancer
7.8%
(2021)
Compared to:
OK Counties
The distribution is based on data from 77 Oklahoma counties.
U.S. Counties
The distribution is based on data from 3,074 U.S. counties and county equivalents.
US Value
(7.0%)
The regional value is compared to the national value.
County: Ottawa Age-Adjusted Death Rate due to Breast Cancer
County: Ottawa Age-Adjusted Death Rate due to Breast Cancer
17.4
Deaths per 100,000 females
(2016-2020)
Compared to:

OK Counties
The distribution is based on data from 39 Oklahoma counties.
U.S. Counties
The distribution is based on data from 1,755 U.S. counties and county equivalents.
OK Value
(22.4)
The regional value is compared to the Oklahoma State value.
US Value
(19.6)
The regional value is compared to the national value.
Prior Value
(17.3)
Prior Value compares a measured value with the previously measured value. Confidence intervals were taken into account in determining the direction of the comparison.
Trend
This comparison measures the indicator’s values over multiple time periods.<br>The Mann-Kendall Test for Statistical Significance is used to evaluate the trend<br>over 4 to 10 periods of measure, subject to data availability and comparability.
HP 2030 Target
(15.3)
County: Ottawa Age-Adjusted Death Rate due to Cancer
County: Ottawa Age-Adjusted Death Rate due to Cancer
213.5
Deaths per 100,000 population
(2016-2020)
Compared to:

OK Counties
The distribution is based on data from 77 Oklahoma counties.
U.S. Counties
The distribution is based on data from 3,085 U.S. counties and county equivalents.
OK Value
(175.2)
The regional value is compared to the Oklahoma State value.
US Value
(149.4)
The regional value is compared to the national value.
Prior Value
(218.6)
Prior Value compares a measured value with the previously measured value. Confidence intervals were taken into account in determining the direction of the comparison.
Trend
This comparison measures the indicator’s values over multiple time periods.<br>The Mann-Kendall Test for Statistical Significance is used to evaluate the trend<br>over 4 to 10 periods of measure, subject to data availability and comparability.
HP 2030 Target
(122.7)
County: Ottawa Age-Adjusted Death Rate due to Colorectal Cancer
County: Ottawa Age-Adjusted Death Rate due to Colorectal Cancer
17.0
Deaths per 100,000 population
(2016-2020)
Compared to:
OK Counties
The distribution is based on data from 51 Oklahoma counties.
U.S. Counties
The distribution is based on data from 2,174 U.S. counties and county equivalents.
OK Value
(16.3)
The regional value is compared to the Oklahoma State value.
US Value
(13.1)
The regional value is compared to the national value.
Prior Value
(18.4)
Prior Value compares a measured value with the previously measured value. Confidence intervals were taken into account in determining the direction of the comparison.
Trend
This comparison measures the indicator’s values over multiple time periods.<br>The Mann-Kendall Test for Statistical Significance is used to evaluate the trend<br>over 4 to 10 periods of measure, subject to data availability and comparability.
HP 2030 Target
(8.9)
County: Ottawa Age-Adjusted Death Rate due to Lung Cancer
County: Ottawa Age-Adjusted Death Rate due to Lung Cancer
70.1
Deaths per 100,000 population
(2016-2020)
Compared to:

OK Counties
The distribution is based on data from 69 Oklahoma counties.
U.S. Counties
The distribution is based on data from 2,752 U.S. counties and county equivalents.
OK Value
(46.5)
The regional value is compared to the Oklahoma State value.
US Value
(35.0)
The regional value is compared to the national value.
Prior Value
(67.1)
Prior Value compares a measured value with the previously measured value. Confidence intervals were taken into account in determining the direction of the comparison.
Trend
This comparison measures the indicator’s values over multiple time periods.<br>The Mann-Kendall Test for Statistical Significance is used to evaluate the trend<br>over 4 to 10 periods of measure, subject to data availability and comparability.
HP 2030 Target
(25.1)
County: Ottawa Age-Adjusted Death Rate due to Prostate Cancer
County: Ottawa Age-Adjusted Death Rate due to Prostate Cancer
20.8
Deaths per 100,000 males
(2016-2020)
Compared to:
U.S. Counties
The distribution is based on data from 1,576 U.S. counties and county equivalents.
OK Value
(20.0)
The regional value is compared to the Oklahoma State value.
US Value
(18.8)
The regional value is compared to the national value.
Prior Value
(21.4)
Prior Value compares a measured value with the previously measured value. Confidence intervals were taken into account in determining the direction of the comparison.
Trend
This comparison measures the indicator’s values over multiple time periods.<br>The Mann-Kendall Test for Statistical Significance is used to evaluate the trend<br>over 4 to 10 periods of measure, subject to data availability and comparability.
HP 2030 Target
(16.9)
County: Ottawa All Cancer Incidence Rate
County: Ottawa All Cancer Incidence Rate
500.8
Cases per 100,000 population
(2016-2020)
Compared to:

OK Counties
The distribution is based on data from 77 Oklahoma counties.
U.S. Counties
The distribution is based on data from 2,693 U.S. counties and county equivalents.
OK Value
(443.4)
The regional value is compared to the Oklahoma State value.
US Value
(442.3)
The regional value is compared to the national value.
Prior Value
(478.0)
Prior Value compares a measured value with the previously measured value. Confidence intervals were taken into account in determining the direction of the comparison.
Trend
This comparison measures the indicator’s values over multiple time periods.<br>The Mann-Kendall Test for Statistical Significance is used to evaluate the trend<br>over 4 to 10 periods of measure, subject to data availability and comparability.
County: Ottawa Breast Cancer Incidence Rate
County: Ottawa Breast Cancer Incidence Rate
106.3
Cases per 100,000 females
(2016-2020)
Compared to:
OK Counties
The distribution is based on data from 69 Oklahoma counties.
U.S. Counties
The distribution is based on data from 2,478 U.S. counties and county equivalents.
OK Value
(122.6)
The regional value is compared to the Oklahoma State value.
US Value
(127.0)
The regional value is compared to the national value.
Prior Value
(85.6)
Prior Value compares a measured value with the previously measured value. Confidence intervals were taken into account in determining the direction of the comparison.
Trend
This comparison measures the indicator’s values over multiple time periods.<br>The Mann-Kendall Test for Statistical Significance is used to evaluate the trend<br>over 4 to 10 periods of measure, subject to data availability and comparability.
County: Ottawa Cancer: Medicare Population
County: Ottawa Cancer: Medicare Population
9.0%
(2022)
Compared to:
OK Counties
The distribution is based on data from 77 Oklahoma counties.
U.S. Counties
The distribution is based on data from 3,129 U.S. counties and county equivalents.
OK Value
(10.0%)
The regional value is compared to the Oklahoma State value.
US Value
(12.0%)
The regional value is compared to the national value.
Prior Value
(9.0%)
Prior Value compares a measured value with the previously measured value. Confidence intervals were not taken into account in determining the direction of the comparison.
Trend
This comparison measures the indicator’s values over multiple time periods.<br>The Mann-Kendall Test for Statistical Significance is used to evaluate the trend<br>over 4 to 10 periods of measure, subject to data availability and comparability.
County: Ottawa Cervical Cancer Screening: 21-65
County: Ottawa Cervical Cancer Screening: 21-65
77.5%
(2020)
Compared to:


OK Counties
The distribution is based on data from 77 Oklahoma counties.
U.S. Counties
The distribution is based on data from 3,141 U.S. counties and county equivalents.
US Value
(82.8%)
The regional value is compared to the national value.
County: Ottawa Colon Cancer Screening
County: Ottawa Colon Cancer Screening
57.5%
(2018)
Compared to:
OK Counties
The distribution is based on data from 77 Oklahoma counties.
U.S. Counties
The distribution is based on data from 3,142 U.S. counties and county equivalents.
US Value
(66.4%)
The regional value is compared to the national value.
County: Ottawa Colon Cancer Screening: USPSTF Recommendation
County: Ottawa Colon Cancer Screening: USPSTF Recommendation
62.8%
(2020)
Compared to:
OK Counties
The distribution is based on data from 77 Oklahoma counties.
U.S. Counties
The distribution is based on data from 3,141 U.S. counties and county equivalents.
US Value
(72.4%)
The regional value is compared to the national value.
County: Ottawa Colorectal Cancer Incidence Rate
County: Ottawa Colorectal Cancer Incidence Rate
46.2
Cases per 100,000 population
(2016-2020)
Compared to:
OK Counties
The distribution is based on data from 69 Oklahoma counties.
U.S. Counties
The distribution is based on data from 2,401 U.S. counties and county equivalents.
OK Value
(39.7)
The regional value is compared to the Oklahoma State value.
US Value
(36.5)
The regional value is compared to the national value.
Prior Value
(40.1)
Prior Value compares a measured value with the previously measured value. Confidence intervals were taken into account in determining the direction of the comparison.
Trend
This comparison measures the indicator’s values over multiple time periods.<br>The Mann-Kendall Test for Statistical Significance is used to evaluate the trend<br>over 4 to 10 periods of measure, subject to data availability and comparability.
County: Ottawa Households that Received Cancer Medical Services
County: Ottawa Households that Received Cancer Medical Services
8.5%
(2023)
Compared to:
OK Value
(8.1%)
The regional value is compared to the Oklahoma State value.
US Value
(8.3%)
The regional value is compared to the national value.
Prior Value
(9.7%)
Prior Value compares a measured value with the previously measured value. Confidence intervals were not taken into account in determining the direction of the comparison.
Trend
This comparison measures the indicator’s values over multiple time periods.<br>The Mann-Kendall Test for Statistical Significance is used to evaluate the trend<br>over 4 to 10 periods of measure, subject to data availability and comparability.
County: Ottawa Lung and Bronchus Cancer Incidence Rate
County: Ottawa Lung and Bronchus Cancer Incidence Rate
80.0
Cases per 100,000 population
(2016-2020)
Compared to:
OK Counties
The distribution is based on data from 74 Oklahoma counties.
U.S. Counties
The distribution is based on data from 2,471 U.S. counties and county equivalents.
OK Value
(63.2)
The regional value is compared to the Oklahoma State value.
US Value
(54.0)
The regional value is compared to the national value.
Prior Value
(79.8)
Prior Value compares a measured value with the previously measured value. Confidence intervals were taken into account in determining the direction of the comparison.
Trend
This comparison measures the indicator’s values over multiple time periods.<br>The Mann-Kendall Test for Statistical Significance is used to evaluate the trend<br>over 4 to 10 periods of measure, subject to data availability and comparability.
County: Ottawa Mammogram in Past 2 Years: 50-74
County: Ottawa Mammogram in Past 2 Years: 50-74
64.6%
(2020)
Compared to:
OK Counties
The distribution is based on data from 77 Oklahoma counties.
U.S. Counties
The distribution is based on data from 3,141 U.S. counties and county equivalents.
US Value
(78.2%)
The regional value is compared to the national value.
HP 2030 Target
(80.3%)
County: Ottawa Mammography Screening: Medicare Population
County: Ottawa Mammography Screening: Medicare Population
39.0%
(2022)
Compared to:
OK Counties
The distribution is based on data from 77 Oklahoma counties.
U.S. Counties
The distribution is based on data from 3,123 U.S. counties and county equivalents.
OK Value
(43.0%)
The regional value is compared to the Oklahoma State value.
US Value
(47.0%)
The regional value is compared to the national value.
Prior Value
(37.0%)
Prior Value compares a measured value with the previously measured value. Confidence intervals were not taken into account in determining the direction of the comparison.
Trend
This comparison measures the indicator’s values over multiple time periods.<br>The Mann-Kendall Test for Statistical Significance is used to evaluate the trend<br>over 4 to 10 periods of measure, subject to data availability and comparability.
County: Ottawa Oral Cavity and Pharynx Cancer Incidence Rate
County: Ottawa Oral Cavity and Pharynx Cancer Incidence Rate
17.6
Cases per 100,000 population
(2016-2020)
Compared to:
OK Counties
The distribution is based on data from 41 Oklahoma counties.
U.S. Counties
The distribution is based on data from 1,706 U.S. counties and county equivalents.
OK Value
(13.0)
The regional value is compared to the Oklahoma State value.
US Value
(11.9)
The regional value is compared to the national value.
Prior Value
(12.0)
Prior Value compares a measured value with the previously measured value. Confidence intervals were taken into account in determining the direction of the comparison.
Trend
This comparison measures the indicator’s values over multiple time periods.<br>The Mann-Kendall Test for Statistical Significance is used to evaluate the trend<br>over 4 to 10 periods of measure, subject to data availability and comparability.
County: Ottawa Prostate Cancer Incidence Rate
County: Ottawa Prostate Cancer Incidence Rate
84.6
Cases per 100,000 males
(2016-2020)
Compared to:
OK Counties
The distribution is based on data from 70 Oklahoma counties.
U.S. Counties
The distribution is based on data from 2,500 U.S. counties and county equivalents.
OK Value
(100.5)
The regional value is compared to the Oklahoma State value.
US Value
(110.5)
The regional value is compared to the national value.
Prior Value
(67.9)
Prior Value compares a measured value with the previously measured value. Confidence intervals were taken into account in determining the direction of the comparison.
Trend
This comparison measures the indicator’s values over multiple time periods.<br>The Mann-Kendall Test for Statistical Significance is used to evaluate the trend<br>over 4 to 10 periods of measure, subject to data availability and comparability.
Health / County Health Rankings
Health / County Health Rankings
County: Ottawa
Value
Compared to:
County: Ottawa Clinical Care Ranking
County: Ottawa Clinical Care Ranking
39
(2023)
Compared to:
OK Counties
The distribution is based on data from 77 Oklahoma counties.
County: Ottawa Health Behaviors Ranking
County: Ottawa Health Behaviors Ranking
61
(2023)
Compared to:
OK Counties
The distribution is based on data from 77 Oklahoma counties.
County: Ottawa Morbidity Ranking
County: Ottawa Morbidity Ranking
63
(2023)
Compared to:
OK Counties
The distribution is based on data from 77 Oklahoma counties.
County: Ottawa Mortality Ranking
County: Ottawa Mortality Ranking
63
(2023)
Compared to:
OK Counties
The distribution is based on data from 77 Oklahoma counties.
County: Ottawa Physical Environment Ranking
County: Ottawa Physical Environment Ranking
27
(2023)
Compared to:
OK Counties
The distribution is based on data from 77 Oklahoma counties.
County: Ottawa Social and Economic Factors Ranking
County: Ottawa Social and Economic Factors Ranking
39
(2023)
Compared to:
OK Counties
The distribution is based on data from 77 Oklahoma counties.
Health / Diabetes
Health / Diabetes
County: Ottawa
Value
Compared to:
County: Ottawa Adults 20+ with Diabetes
County: Ottawa Adults 20+ with Diabetes
12.2%
(2021)
Compared to:
OK Counties
The distribution is based on data from 77 Oklahoma counties.
U.S. Counties
The distribution is based on data from 3,074 U.S. counties and county equivalents.
Prior Value
(9.7%)
Prior Value compares a measured value with the previously measured value. Confidence intervals were taken into account in determining the direction of the comparison.
Trend
This comparison measures the indicator’s values over multiple time periods.<br>The Mann-Kendall Test for Statistical Significance is used to evaluate the trend<br>over 4 to 10 periods of measure, subject to data availability and comparability.
County: Ottawa Adults Who Bought Medications for Diabetes
County: Ottawa Adults Who Bought Medications for Diabetes
13.5%
(2023)
Compared to:

OK Value
(11.7%)
The regional value is compared to the Oklahoma State value.
US Value
(10.7%)
The regional value is compared to the national value.
Prior Value
(13.6%)
Prior Value compares a measured value with the previously measured value. Confidence intervals were not taken into account in determining the direction of the comparison.
Trend
This comparison measures the indicator’s values over multiple time periods.<br>The Mann-Kendall Test for Statistical Significance is used to evaluate the trend<br>over 4 to 10 periods of measure, subject to data availability and comparability.
County: Ottawa Age-Adjusted Death Rate due to Diabetes
County: Ottawa Age-Adjusted Death Rate due to Diabetes
21.6
Deaths per 100,000 population
(2019-2021)
Compared to:
OK Counties
The distribution is based on data from 72 Oklahoma counties.
OK Value
(31.9)
The regional value is compared to the Oklahoma State value.
US Value
(24.8 in 2020)
The regional value is compared to the national value. The source for the national value is Centers for Disease Control and Prevention
County: Ottawa Diabetes: Medicare Population
County: Ottawa Diabetes: Medicare Population
28.0%
(2022)
Compared to:
OK Counties
The distribution is based on data from 77 Oklahoma counties.
U.S. Counties
The distribution is based on data from 3,129 U.S. counties and county equivalents.
OK Value
(27.0%)
The regional value is compared to the Oklahoma State value.
US Value
(24.0%)
The regional value is compared to the national value.
Prior Value
(29.0%)
Prior Value compares a measured value with the previously measured value. Confidence intervals were not taken into account in determining the direction of the comparison.
Trend
This comparison measures the indicator’s values over multiple time periods.<br>The Mann-Kendall Test for Statistical Significance is used to evaluate the trend<br>over 4 to 10 periods of measure, subject to data availability and comparability.
Health / Disabilities
Health / Disabilities
County: Ottawa
Value
Compared to:
County: Ottawa Adults with Disability Living in Poverty
County: Ottawa Adults with Disability Living in Poverty
29.8%
(2018-2022)
Compared to:
OK Counties
The distribution is based on data from 77 Oklahoma counties.
U.S. Counties
The distribution is based on data from 3,132 U.S. counties and county equivalents.
OK Value
(25.5%)
The regional value is compared to the Oklahoma State value.
US Value
(24.9%)
The regional value is compared to the national value.
Trend
This comparison measures the indicator’s values over multiple time periods.<br>The Mann-Kendall Test for Statistical Significance is used to evaluate the trend<br>over 4 to 10 periods of measure, subject to data availability and comparability.
County: Ottawa Children with a Disability
County: Ottawa Children with a Disability
6.4%
(2018-2022)
Compared to:
OK Value
(5.4%)
The regional value is compared to the Oklahoma State value.
US Value
(4.5%)
The regional value is compared to the national value.
Trend
This comparison measures the indicator’s values over multiple time periods.<br>The Mann-Kendall Test for Statistical Significance is used to evaluate the trend<br>over 4 to 10 periods of measure, subject to data availability and comparability.
County: Ottawa Persons with a Cognitive Difficulty
County: Ottawa Persons with a Cognitive Difficulty
8.6%
(2018-2022)
Compared to:

OK Value
(6.5%)
The regional value is compared to the Oklahoma State value.
US Value
(5.3%)
The regional value is compared to the national value.
Trend
This comparison measures the indicator’s values over multiple time periods.<br>The Mann-Kendall Test for Statistical Significance is used to evaluate the trend<br>over 4 to 10 periods of measure, subject to data availability and comparability.
County: Ottawa Persons with a Disability
County: Ottawa Persons with a Disability
20.8%
(2018-2022)
Compared to:
OK Value
(16.6%)
The regional value is compared to the Oklahoma State value.
US Value
(12.9%)
The regional value is compared to the national value.
Trend
This comparison measures the indicator’s values over multiple time periods.<br>The Mann-Kendall Test for Statistical Significance is used to evaluate the trend<br>over 4 to 10 periods of measure, subject to data availability and comparability.
County: Ottawa Persons with a Hearing Difficulty
County: Ottawa Persons with a Hearing Difficulty
7.5%
(2018-2022)
Compared to:
OK Value
(5.2%)
The regional value is compared to the Oklahoma State value.
US Value
(3.6%)
The regional value is compared to the national value.
Trend
This comparison measures the indicator’s values over multiple time periods.<br>The Mann-Kendall Test for Statistical Significance is used to evaluate the trend<br>over 4 to 10 periods of measure, subject to data availability and comparability.
County: Ottawa Persons with a Self-Care Difficulty
County: Ottawa Persons with a Self-Care Difficulty
2.9%
(2018-2022)
Compared to:

OK Value
(2.8%)
The regional value is compared to the Oklahoma State value.
US Value
(2.6%)
The regional value is compared to the national value.
Trend
This comparison measures the indicator’s values over multiple time periods.<br>The Mann-Kendall Test for Statistical Significance is used to evaluate the trend<br>over 4 to 10 periods of measure, subject to data availability and comparability.
County: Ottawa Persons with a Vision Difficulty
County: Ottawa Persons with a Vision Difficulty
5.0%
(2018-2022)
Compared to:
OK Value
(3.5%)
The regional value is compared to the Oklahoma State value.
US Value
(2.4%)
The regional value is compared to the national value.
Trend
This comparison measures the indicator’s values over multiple time periods.<br>The Mann-Kendall Test for Statistical Significance is used to evaluate the trend<br>over 4 to 10 periods of measure, subject to data availability and comparability.
County: Ottawa Persons with an Ambulatory Difficulty
County: Ottawa Persons with an Ambulatory Difficulty
10.4%
(2018-2022)
Compared to:
OK Value
(8.8%)
The regional value is compared to the Oklahoma State value.
US Value
(6.7%)
The regional value is compared to the national value.
Trend
This comparison measures the indicator’s values over multiple time periods.<br>The Mann-Kendall Test for Statistical Significance is used to evaluate the trend<br>over 4 to 10 periods of measure, subject to data availability and comparability.
Health / Family Planning
Health / Family Planning
County: Ottawa
Value
Compared to:
County: Ottawa Teen Birth Rate: 15-19
County: Ottawa Teen Birth Rate: 15-19
25.9
Live births per 1,000 females aged 15-19
(2022)
Compared to:
OK Counties
The distribution is based on data from 63 Oklahoma counties.
OK Value
(21.2)
The regional value is compared to the Oklahoma State value.
US Value
(13.9 in 2021)
The regional value is compared to the national value. The source for the national value is Centers for Disease Control and Prevention, National Center for Health Statistics
Prior Value
(29.7)
Prior Value compares a measured value with the previously measured value. Confidence intervals were not taken into account in determining the direction of the comparison.
Health / Health Care Access & Quality
Health / Health Care Access & Quality
County: Ottawa
Value
Compared to:
County: Ottawa Adults who go to the Doctor Regularly for Checkups
County: Ottawa Adults who go to the Doctor Regularly for Checkups
69.7%
(2023)
Compared to:
OK Counties
The distribution is based on data from 77 Oklahoma counties.
OK Value
(71.6%)
The regional value is compared to the Oklahoma State value.
US Value
(74.2%)
The regional value is compared to the national value.
Prior Value
(66.4%)
Prior Value compares a measured value with the previously measured value. Confidence intervals were not taken into account in determining the direction of the comparison.
County: Ottawa Adults who have had a Routine Checkup
County: Ottawa Adults who have had a Routine Checkup
75.1%
(2021)
Compared to:
OK Counties
The distribution is based on data from 77 Oklahoma counties.
U.S. Counties
The distribution is based on data from 3,074 U.S. counties and county equivalents.
US Value
(73.6%)
The regional value is compared to the national value.
County: Ottawa Adults with Health Insurance: 18+
County: Ottawa Adults with Health Insurance: 18+
78.1%
(2023)
Compared to:


OK Counties
The distribution is based on data from 77 Oklahoma counties.
U.S. Counties
The distribution is based on data from 3,141 U.S. counties and county equivalents.
OK Value
(82.6%)
The regional value is compared to the Oklahoma State value.
US Value
(85.9%)
The regional value is compared to the national value.
Prior Value
(89.5%)
Prior Value compares a measured value with the previously measured value. Confidence intervals were not taken into account in determining the direction of the comparison.
Trend
This comparison measures the indicator’s values over multiple time periods.<br>The Mann-Kendall Test for Statistical Significance is used to evaluate the trend<br>over 4 to 10 periods of measure, subject to data availability and comparability.
County: Ottawa Adults with Health Insurance: 18-64
County: Ottawa Adults with Health Insurance: 18-64
74.4%
(2021)
Compared to:

OK Counties
The distribution is based on data from 77 Oklahoma counties.
U.S. Counties
The distribution is based on data from 3,140 U.S. counties and county equivalents.
OK Value
(79.4%)
The regional value is compared to the Oklahoma State value.
Prior Value
(73.4%)
Prior Value compares a measured value with the previously measured value. Confidence intervals were taken into account in determining the direction of the comparison.
Trend
This comparison measures the indicator’s values over multiple time periods.<br>The Mann-Kendall Test for Statistical Significance is used to evaluate the trend<br>over 4 to 10 periods of measure, subject to data availability and comparability.
County: Ottawa Adults with HMO Health Insurance
County: Ottawa Adults with HMO Health Insurance
8.8%
(2023)
Compared to:

OK Value
(11.7%)
The regional value is compared to the Oklahoma State value.
US Value
(14.2%)
The regional value is compared to the national value.
Prior Value
(8.9%)
Prior Value compares a measured value with the previously measured value. Confidence intervals were not taken into account in determining the direction of the comparison.
County: Ottawa Adults with Medicaid Health Insurance
County: Ottawa Adults with Medicaid Health Insurance
18.1%
(2023)
Compared to:

OK Value
(14.3%)
The regional value is compared to the Oklahoma State value.
US Value
(11.9%)
The regional value is compared to the national value.
Prior Value
(16.3%)
Prior Value compares a measured value with the previously measured value. Confidence intervals were not taken into account in determining the direction of the comparison.
Trend
This comparison measures the indicator’s values over multiple time periods.<br>The Mann-Kendall Test for Statistical Significance is used to evaluate the trend<br>over 4 to 10 periods of measure, subject to data availability and comparability.
County: Ottawa Adults with Medicare Health Insurance
County: Ottawa Adults with Medicare Health Insurance
24.5%
(2023)
Compared to:
OK Value
(19.4%)
The regional value is compared to the Oklahoma State value.
US Value
(18.6%)
The regional value is compared to the national value.
Prior Value
(27.9%)
Prior Value compares a measured value with the previously measured value. Confidence intervals were not taken into account in determining the direction of the comparison.
Trend
This comparison measures the indicator’s values over multiple time periods.<br>The Mann-Kendall Test for Statistical Significance is used to evaluate the trend<br>over 4 to 10 periods of measure, subject to data availability and comparability.
County: Ottawa Adults with PPO Health Insurance
County: Ottawa Adults with PPO Health Insurance
25.6%
(2023)
Compared to:
OK Value
(31.6%)
The regional value is compared to the Oklahoma State value.
US Value
(33.9%)
The regional value is compared to the national value.
Prior Value
(25.7%)
Prior Value compares a measured value with the previously measured value. Confidence intervals were not taken into account in determining the direction of the comparison.
Trend
This comparison measures the indicator’s values over multiple time periods.<br>The Mann-Kendall Test for Statistical Significance is used to evaluate the trend<br>over 4 to 10 periods of measure, subject to data availability and comparability.
County: Ottawa Adults without Health Insurance
County: Ottawa Adults without Health Insurance
14.0%
(2021)
Compared to:
OK Counties
The distribution is based on data from 77 Oklahoma counties.
U.S. Counties
The distribution is based on data from 3,074 U.S. counties and county equivalents.
US Value
(10.8%)
The regional value is compared to the national value.
County: Ottawa Children with Health Insurance
County: Ottawa Children with Health Insurance
92.3%
(2021)
Compared to:
OK Counties
The distribution is based on data from 77 Oklahoma counties.
U.S. Counties
The distribution is based on data from 3,140 U.S. counties and county equivalents.
OK Value
(92.0%)
The regional value is compared to the Oklahoma State value.
Prior Value
(87.7%)
Prior Value compares a measured value with the previously measured value. Confidence intervals were taken into account in determining the direction of the comparison.
Trend
This comparison measures the indicator’s values over multiple time periods.<br>The Mann-Kendall Test for Statistical Significance is used to evaluate the trend<br>over 4 to 10 periods of measure, subject to data availability and comparability.
County: Ottawa Households that Received Cardiology Medical Services
County: Ottawa Households that Received Cardiology Medical Services
13.9%
(2023)
Compared to:
OK Value
(12.3%)
The regional value is compared to the Oklahoma State value.
US Value
(11.8%)
The regional value is compared to the national value.
Prior Value
(14.6%)
Prior Value compares a measured value with the previously measured value. Confidence intervals were not taken into account in determining the direction of the comparison.
Trend
This comparison measures the indicator’s values over multiple time periods.<br>The Mann-Kendall Test for Statistical Significance is used to evaluate the trend<br>over 4 to 10 periods of measure, subject to data availability and comparability.
29.9%
(2023)
Compared to:
OK Value
(28.9%)
The regional value is compared to the Oklahoma State value.
US Value
(28.0%)
The regional value is compared to the national value.
Prior Value
(30.4%)
Prior Value compares a measured value with the previously measured value. Confidence intervals were not taken into account in determining the direction of the comparison.
Trend
This comparison measures the indicator’s values over multiple time periods.<br>The Mann-Kendall Test for Statistical Significance is used to evaluate the trend<br>over 4 to 10 periods of measure, subject to data availability and comparability.
County: Ottawa Non-Physician Primary Care Provider Rate
County: Ottawa Non-Physician Primary Care Provider Rate
99
Providers per 100,000 population
(2023)
Compared to:
OK Counties
The distribution is based on data from 76 Oklahoma counties.
U.S. Counties
The distribution is based on data from 3,129 U.S. counties and county equivalents.
OK Value
(122)
The regional value is compared to the Oklahoma State value.
Prior Value
(89)
Prior Value compares a measured value with the previously measured value. Confidence intervals were not taken into account in determining the direction of the comparison.
Trend
This comparison measures the indicator’s values over multiple time periods.<br>The Mann-Kendall Test for Statistical Significance is used to evaluate the trend<br>over 4 to 10 periods of measure, subject to data availability and comparability.
County: Ottawa Persons with Health Insurance
County: Ottawa Persons with Health Insurance
80.0%
(2021)
Compared to:
OK Counties
The distribution is based on data from 77 Oklahoma counties.
U.S. Counties
The distribution is based on data from 3,140 U.S. counties and county equivalents.
OK Value
(83.1%)
The regional value is compared to the Oklahoma State value.
Prior Value
(77.9%)
Prior Value compares a measured value with the previously measured value. Confidence intervals were taken into account in determining the direction of the comparison.
Trend
This comparison measures the indicator’s values over multiple time periods.<br>The Mann-Kendall Test for Statistical Significance is used to evaluate the trend<br>over 4 to 10 periods of measure, subject to data availability and comparability.
HP 2030 Target
(92.4%)
<div>AHS-01: Increase the proportion of people with health insurance <strong>(LEADING HEALTH INDICATOR)</strong></div>
County: Ottawa Preventable Hospital Stays: Medicare Population
County: Ottawa Preventable Hospital Stays: Medicare Population
2,713.0
Discharges per 100,000 Medicare enrollees
(2022)
Compared to:

OK Counties
The distribution is based on data from 77 Oklahoma counties.
U.S. Counties
The distribution is based on data from 3,129 U.S. counties and county equivalents.
OK Value
(2,983.0)
The regional value is compared to the Oklahoma State value.
US Value
(2,677.0)
The regional value is compared to the national value.
Prior Value
(2,683.0)
Prior Value compares a measured value with the previously measured value. Confidence intervals were not taken into account in determining the direction of the comparison.
Trend
This comparison measures the indicator’s values over multiple time periods.<br>The Mann-Kendall Test for Statistical Significance is used to evaluate the trend<br>over 4 to 10 periods of measure, subject to data availability and comparability.
County: Ottawa Primary Care Provider Rate
County: Ottawa Primary Care Provider Rate
46
Providers per 100,000 population
(2021)
Compared to:
OK Counties
The distribution is based on data from 72 Oklahoma counties.
U.S. Counties
The distribution is based on data from 2,984 U.S. counties and county equivalents.
OK Value
(59)
The regional value is compared to the Oklahoma State value.
Prior Value
(52)
Prior Value compares a measured value with the previously measured value. Confidence intervals were not taken into account in determining the direction of the comparison.
Trend
This comparison measures the indicator’s values over multiple time periods.<br>The Mann-Kendall Test for Statistical Significance is used to evaluate the trend<br>over 4 to 10 periods of measure, subject to data availability and comparability.
Health / Health Information Technology
Health / Health Information Technology
County: Ottawa
Value
Compared to:
25.4%
(2023)
Compared to:
OK Value
(29.4%)
The regional value is compared to the Oklahoma State value.
US Value
(31.8%)
The regional value is compared to the national value.
Prior Value
(29.9%)
Prior Value compares a measured value with the previously measured value. Confidence intervals were not taken into account in determining the direction of the comparison.
County: Ottawa Adults with Internet Access
County: Ottawa Adults with Internet Access
83.2%
(2023)
Compared to:
OK Counties
The distribution is based on data from 77 Oklahoma counties.
U.S. Counties
The distribution is based on data from 3,141 U.S. counties and county equivalents.
OK Value
(89.0%)
The regional value is compared to the Oklahoma State value.
US Value
(91.7%)
The regional value is compared to the national value.
Prior Value
(91.8%)
Prior Value compares a measured value with the previously measured value. Confidence intervals were not taken into account in determining the direction of the comparison.
Trend
This comparison measures the indicator’s values over multiple time periods.<br>The Mann-Kendall Test for Statistical Significance is used to evaluate the trend<br>over 4 to 10 periods of measure, subject to data availability and comparability.
County: Ottawa Households with a Computer
County: Ottawa Households with a Computer
80.3%
(2023)
Compared to:
OK Counties
The distribution is based on data from 77 Oklahoma counties.
U.S. Counties
The distribution is based on data from 3,141 U.S. counties and county equivalents.
OK Value
(86.0%)
The regional value is compared to the Oklahoma State value.
US Value
(88.2%)
The regional value is compared to the national value.
Prior Value
(80.2%)
Prior Value compares a measured value with the previously measured value. Confidence intervals were not taken into account in determining the direction of the comparison.
Trend
This comparison measures the indicator’s values over multiple time periods.<br>The Mann-Kendall Test for Statistical Significance is used to evaluate the trend<br>over 4 to 10 periods of measure, subject to data availability and comparability.
County: Ottawa Households with a Smartphone
County: Ottawa Households with a Smartphone
76.5%
(2023)
Compared to:
OK Counties
The distribution is based on data from 77 Oklahoma counties.
U.S. Counties
The distribution is based on data from 3,141 U.S. counties and county equivalents.
OK Value
(82.7%)
The regional value is compared to the Oklahoma State value.
US Value
(84.7%)
The regional value is compared to the national value.
Prior Value
(75.3%)
Prior Value compares a measured value with the previously measured value. Confidence intervals were not taken into account in determining the direction of the comparison.
Trend
This comparison measures the indicator’s values over multiple time periods.<br>The Mann-Kendall Test for Statistical Significance is used to evaluate the trend<br>over 4 to 10 periods of measure, subject to data availability and comparability.
County: Ottawa Households with an Internet Subscription
County: Ottawa Households with an Internet Subscription
78.4%
(2018-2022)
Compared to:
OK Counties
The distribution is based on data from 77 Oklahoma counties.
U.S. Counties
The distribution is based on data from 3,133 U.S. counties and county equivalents.
OK Value
(85.8%)
The regional value is compared to the Oklahoma State value.
US Value
(88.5%)
The regional value is compared to the national value.
Trend
This comparison measures the indicator’s values over multiple time periods.<br>The Mann-Kendall Test for Statistical Significance is used to evaluate the trend<br>over 4 to 10 periods of measure, subject to data availability and comparability.
County: Ottawa Households with One or More Types of Computing Devices
County: Ottawa Households with One or More Types of Computing Devices
89.5%
(2018-2022)
Compared to:
OK Counties
The distribution is based on data from 77 Oklahoma counties.
U.S. Counties
The distribution is based on data from 3,133 U.S. counties and county equivalents.
OK Value
(93.1%)
The regional value is compared to the Oklahoma State value.
US Value
(94.0%)
The regional value is compared to the national value.
Trend
This comparison measures the indicator’s values over multiple time periods.<br>The Mann-Kendall Test for Statistical Significance is used to evaluate the trend<br>over 4 to 10 periods of measure, subject to data availability and comparability.
County: Ottawa Persons with an Internet Subscription
County: Ottawa Persons with an Internet Subscription
83.7%
(2018-2022)
Compared to:
OK Counties
The distribution is based on data from 77 Oklahoma counties.
U.S. Counties
The distribution is based on data from 3,133 U.S. counties and county equivalents.
OK Value
(88.7%)
The regional value is compared to the Oklahoma State value.
US Value
(91.0%)
The regional value is compared to the national value.
Trend
This comparison measures the indicator’s values over multiple time periods.<br>The Mann-Kendall Test for Statistical Significance is used to evaluate the trend<br>over 4 to 10 periods of measure, subject to data availability and comparability.
Health / Heart Disease & Stroke
Health / Heart Disease & Stroke
County: Ottawa
Value
Compared to:
County: Ottawa Adults Who Bought Medications for Cholesterol
County: Ottawa Adults Who Bought Medications for Cholesterol
19.7%
(2023)
Compared to:
OK Value
(17.4%)
The regional value is compared to the Oklahoma State value.
US Value
(17.1%)
The regional value is compared to the national value.
Prior Value
(20.0%)
Prior Value compares a measured value with the previously measured value. Confidence intervals were not taken into account in determining the direction of the comparison.
Trend
This comparison measures the indicator’s values over multiple time periods.<br>The Mann-Kendall Test for Statistical Significance is used to evaluate the trend<br>over 4 to 10 periods of measure, subject to data availability and comparability.
County: Ottawa Adults Who Bought Medications for High Blood Pressure
County: Ottawa Adults Who Bought Medications for High Blood Pressure
30.6%
(2023)
Compared to:
OK Value
(26.2%)
The regional value is compared to the Oklahoma State value.
US Value
(24.4%)
The regional value is compared to the national value.
Prior Value
(30.9%)
Prior Value compares a measured value with the previously measured value. Confidence intervals were not taken into account in determining the direction of the comparison.
Trend
This comparison measures the indicator’s values over multiple time periods.<br>The Mann-Kendall Test for Statistical Significance is used to evaluate the trend<br>over 4 to 10 periods of measure, subject to data availability and comparability.
County: Ottawa Adults who Experienced a Stroke
County: Ottawa Adults who Experienced a Stroke
4.4%
(2021)
Compared to:
OK Counties
The distribution is based on data from 77 Oklahoma counties.
U.S. Counties
The distribution is based on data from 3,074 U.S. counties and county equivalents.
US Value
(3.3%)
The regional value is compared to the national value.
County: Ottawa Adults who Experienced Coronary Heart Disease
County: Ottawa Adults who Experienced Coronary Heart Disease
8.8%
(2021)
Compared to:
OK Counties
The distribution is based on data from 77 Oklahoma counties.
U.S. Counties
The distribution is based on data from 3,074 U.S. counties and county equivalents.
US Value
(6.1%)
The regional value is compared to the national value.
County: Ottawa Adults who Have Taken Medications for High Blood Pressure
County: Ottawa Adults who Have Taken Medications for High Blood Pressure
78.8%
(2021)
Compared to:
OK Counties
The distribution is based on data from 77 Oklahoma counties.
U.S. Counties
The distribution is based on data from 3,074 U.S. counties and county equivalents.
US Value
(78.2%)
The regional value is compared to the national value.
County: Ottawa Adults Who Visited a Cardiologist
County: Ottawa Adults Who Visited a Cardiologist
14.8%
(2023)
Compared to:
OK Value
(13.1%)
The regional value is compared to the Oklahoma State value.
US Value
(13.2%)
The regional value is compared to the national value.
Prior Value
(15.4%)
Prior Value compares a measured value with the previously measured value. Confidence intervals were not taken into account in determining the direction of the comparison.
Trend
This comparison measures the indicator’s values over multiple time periods.<br>The Mann-Kendall Test for Statistical Significance is used to evaluate the trend<br>over 4 to 10 periods of measure, subject to data availability and comparability.
61.6
Deaths per 100,000 population
(2019-2021)
Compared to:
OK Counties
The distribution is based on data from 72 Oklahoma counties.
OK Value
(40.6)
The regional value is compared to the Oklahoma State value.
US Value
(38.8 in 2020)
The regional value is compared to the national value. The source for the national value is Centers for Disease Control and Prevention
HP 2030 Target
(33.4)
County: Ottawa Age-Adjusted Death Rate due to Heart Attack
County: Ottawa Age-Adjusted Death Rate due to Heart Attack
123.2
Deaths per 100,000 population 35+ years
(2020)
Compared to:
OK Counties
(2016)
The distribution is based on data from 77 Oklahoma counties.
OK Value
(39.4)
The regional value is compared to the Oklahoma State value.
Prior Value
(124.4)
Prior Value compares a measured value with the previously measured value. Confidence intervals were not taken into account in determining the direction of the comparison.
Trend
This comparison measures the indicator’s values over multiple time periods.<br>The Mann-Kendall Test for Statistical Significance is used to evaluate the trend<br>over 4 to 10 periods of measure, subject to data availability and comparability.
County: Ottawa Age-Adjusted Death Rate due to Heart Disease
County: Ottawa Age-Adjusted Death Rate due to Heart Disease
348.7
Deaths per 100,000 population
(2019-2021)
Compared to:
OK Counties
The distribution is based on data from 77 Oklahoma counties.
OK Value
(246.2)
The regional value is compared to the Oklahoma State value.
County: Ottawa Atrial Fibrillation: Medicare Population
County: Ottawa Atrial Fibrillation: Medicare Population
16.0%
(2022)
Compared to:
OK Counties
The distribution is based on data from 77 Oklahoma counties.
U.S. Counties
The distribution is based on data from 3,129 U.S. counties and county equivalents.
OK Value
(15.0%)
The regional value is compared to the Oklahoma State value.
US Value
(14.0%)
The regional value is compared to the national value.
Prior Value
(16.0%)
Prior Value compares a measured value with the previously measured value. Confidence intervals were not taken into account in determining the direction of the comparison.
Trend
This comparison measures the indicator’s values over multiple time periods.<br>The Mann-Kendall Test for Statistical Significance is used to evaluate the trend<br>over 4 to 10 periods of measure, subject to data availability and comparability.
County: Ottawa Cholesterol Test History
County: Ottawa Cholesterol Test History
80.6%
(2021)
Compared to:
OK Counties
The distribution is based on data from 77 Oklahoma counties.
U.S. Counties
The distribution is based on data from 3,074 U.S. counties and county equivalents.
US Value
(86.4%)
The regional value is compared to the national value.
County: Ottawa Heart Failure: Medicare Population
County: Ottawa Heart Failure: Medicare Population
13.0%
(2022)
Compared to:
OK Counties
The distribution is based on data from 77 Oklahoma counties.
U.S. Counties
The distribution is based on data from 3,129 U.S. counties and county equivalents.
OK Value
(13.0%)
The regional value is compared to the Oklahoma State value.
US Value
(11.0%)
The regional value is compared to the national value.
Prior Value
(13.0%)
Prior Value compares a measured value with the previously measured value. Confidence intervals were not taken into account in determining the direction of the comparison.
Trend
This comparison measures the indicator’s values over multiple time periods.<br>The Mann-Kendall Test for Statistical Significance is used to evaluate the trend<br>over 4 to 10 periods of measure, subject to data availability and comparability.
County: Ottawa High Blood Pressure Prevalence
County: Ottawa High Blood Pressure Prevalence
43.2%
(2021)
Compared to:
OK Counties
The distribution is based on data from 77 Oklahoma counties.
U.S. Counties
The distribution is based on data from 3,074 U.S. counties and county equivalents.
US Value
(32.7%)
The regional value is compared to the national value.
HP 2030 Target
(41.9%)
County: Ottawa High Cholesterol Prevalence: Past 5 Years
County: Ottawa High Cholesterol Prevalence: Past 5 Years
39.5%
(2021)
Compared to:
OK Counties
The distribution is based on data from 77 Oklahoma counties.
U.S. Counties
The distribution is based on data from 3,074 U.S. counties and county equivalents.
US Value
(36.4%)
The regional value is compared to the national value.
County: Ottawa Hyperlipidemia: Medicare Population
County: Ottawa Hyperlipidemia: Medicare Population
61.0%
(2022)
Compared to:
OK Counties
The distribution is based on data from 77 Oklahoma counties.
U.S. Counties
The distribution is based on data from 3,129 U.S. counties and county equivalents.
OK Value
(62.0%)
The regional value is compared to the Oklahoma State value.
US Value
(65.0%)
The regional value is compared to the national value.
Prior Value
(62.0%)
Prior Value compares a measured value with the previously measured value. Confidence intervals were not taken into account in determining the direction of the comparison.
Trend
This comparison measures the indicator’s values over multiple time periods.<br>The Mann-Kendall Test for Statistical Significance is used to evaluate the trend<br>over 4 to 10 periods of measure, subject to data availability and comparability.
County: Ottawa Hypertension: Medicare Population
County: Ottawa Hypertension: Medicare Population
71.0%
(2022)
Compared to:
OK Counties
The distribution is based on data from 77 Oklahoma counties.
U.S. Counties
The distribution is based on data from 3,129 U.S. counties and county equivalents.
OK Value
(70.0%)
The regional value is compared to the Oklahoma State value.
US Value
(65.0%)
The regional value is compared to the national value.
Prior Value
(71.0%)
Prior Value compares a measured value with the previously measured value. Confidence intervals were not taken into account in determining the direction of the comparison.
Trend
This comparison measures the indicator’s values over multiple time periods.<br>The Mann-Kendall Test for Statistical Significance is used to evaluate the trend<br>over 4 to 10 periods of measure, subject to data availability and comparability.
County: Ottawa Ischemic Heart Disease: Medicare Population
County: Ottawa Ischemic Heart Disease: Medicare Population
26.0%
(2022)
Compared to:
OK Counties
The distribution is based on data from 77 Oklahoma counties.
U.S. Counties
The distribution is based on data from 3,129 U.S. counties and county equivalents.
OK Value
(25.0%)
The regional value is compared to the Oklahoma State value.
US Value
(21.0%)
The regional value is compared to the national value.
Prior Value
(27.0%)
Prior Value compares a measured value with the previously measured value. Confidence intervals were not taken into account in determining the direction of the comparison.
Trend
This comparison measures the indicator’s values over multiple time periods.<br>The Mann-Kendall Test for Statistical Significance is used to evaluate the trend<br>over 4 to 10 periods of measure, subject to data availability and comparability.
County: Ottawa Stroke: Medicare Population
County: Ottawa Stroke: Medicare Population
4.0%
(2022)
Compared to:
OK Counties
The distribution is based on data from 77 Oklahoma counties.
U.S. Counties
The distribution is based on data from 3,129 U.S. counties and county equivalents.
OK Value
(5.0%)
The regional value is compared to the Oklahoma State value.
US Value
(6.0%)
The regional value is compared to the national value.
Prior Value
(5.0%)
Prior Value compares a measured value with the previously measured value. Confidence intervals were not taken into account in determining the direction of the comparison.
Trend
This comparison measures the indicator’s values over multiple time periods.<br>The Mann-Kendall Test for Statistical Significance is used to evaluate the trend<br>over 4 to 10 periods of measure, subject to data availability and comparability.
Health / Immunizations & Infectious Diseases
Health / Immunizations & Infectious Diseases
County: Ottawa
Value
Compared to:
County: Ottawa Age-Adjusted Death Rate due to Influenza and Pneumonia
County: Ottawa Age-Adjusted Death Rate due to Influenza and Pneumonia
22.0
Deaths per 100,000 population
(2019-2021)
Compared to:
OK Counties
The distribution is based on data from 59 Oklahoma counties.
OK Value
(13.2)
The regional value is compared to the Oklahoma State value.
US Value
(13.0 in 2020)
The regional value is compared to the national value. The source for the national value is Centers for Disease Control and Prevention
County: Ottawa COVID-19 Daily Average Case-Fatality Rate
County: Ottawa COVID-19 Daily Average Case-Fatality Rate
2.3
Deaths per 100 cases
(Mar 3, 2023)
Compared to:
OK Counties
(Dec 2, 2022)
The distribution is based on data from 71 Oklahoma counties.
U.S. Counties
(Mar 25, 2022)
The distribution is based on data from 2,811 U.S. counties and county equivalents.
OK Value
(1.1)
The regional value is compared to the Oklahoma State value.
US Value
(1.7)
The regional value is compared to the national value.
Prior Value
(0.0)
Prior Value compares a measured value with the previously measured value. Confidence intervals were not taken into account in determining the direction of the comparison.
Trend
This comparison measures the indicator’s values over multiple time periods.<br>The Mann-Kendall Test for Statistical Significance is used to evaluate the trend<br>over 4 to 10 periods of measure, subject to data availability and comparability.
County: Ottawa COVID-19 Daily Average Incidence Rate
County: Ottawa COVID-19 Daily Average Incidence Rate
20.90
Cases per 100,000 population
(Mar 3, 2023)
Compared to:
OK Counties
The distribution is based on data from 77 Oklahoma counties.
U.S. Counties
The distribution is based on data from 3,142 U.S. counties and county equivalents.
OK Value
(11.67)
The regional value is compared to the Oklahoma State value.
US Value
(10.97)
The regional value is compared to the national value.
Prior Value
(9.02)
Prior Value compares a measured value with the previously measured value. Confidence intervals were not taken into account in determining the direction of the comparison.
Trend
This comparison measures the indicator’s values over multiple time periods.<br>The Mann-Kendall Test for Statistical Significance is used to evaluate the trend<br>over 4 to 10 periods of measure, subject to data availability and comparability.
County: Ottawa Flu Vaccinations: Medicare Population
County: Ottawa Flu Vaccinations: Medicare Population
33.0%
(2022)
Compared to:
OK Counties
The distribution is based on data from 77 Oklahoma counties.
U.S. Counties
The distribution is based on data from 3,129 U.S. counties and county equivalents.
OK Value
(44.0%)
The regional value is compared to the Oklahoma State value.
US Value
(50.0%)
The regional value is compared to the national value.
Prior Value
(43.0%)
Prior Value compares a measured value with the previously measured value. Confidence intervals were not taken into account in determining the direction of the comparison.
Trend
This comparison measures the indicator’s values over multiple time periods.<br>The Mann-Kendall Test for Statistical Significance is used to evaluate the trend<br>over 4 to 10 periods of measure, subject to data availability and comparability.
County: Ottawa Pneumonia Vaccinations: Medicare Population
County: Ottawa Pneumonia Vaccinations: Medicare Population
5.0%
(2022)
Compared to:
OK Counties
The distribution is based on data from 77 Oklahoma counties.
U.S. Counties
The distribution is based on data from 3,129 U.S. counties and county equivalents.
OK Value
(8.0%)
The regional value is compared to the Oklahoma State value.
US Value
(8.0%)
The regional value is compared to the national value.
Prior Value
(7.0%)
Prior Value compares a measured value with the previously measured value. Confidence intervals were not taken into account in determining the direction of the comparison.
Trend
This comparison measures the indicator’s values over multiple time periods.<br>The Mann-Kendall Test for Statistical Significance is used to evaluate the trend<br>over 4 to 10 periods of measure, subject to data availability and comparability.
Health / Maternal, Fetal & Infant Health
Health / Maternal, Fetal & Infant Health
County: Ottawa
Value
Compared to:
County: Ottawa Babies with Low Birthweight
County: Ottawa Babies with Low Birthweight
9.2%
(2022)
Compared to:
OK Counties
The distribution is based on data from 63 Oklahoma counties.
OK Value
(8.5%)
The regional value is compared to the Oklahoma State value.
US Value
(8.5% in 2021)
The regional value is compared to the national value. The source for the national value is Centers for Disease Control and Prevention
Prior Value
(11.7%)
Prior Value compares a measured value with the previously measured value. Confidence intervals were not taken into account in determining the direction of the comparison.
County: Ottawa Babies with Very Low Birthweight
County: Ottawa Babies with Very Low Birthweight
1.8%
(2022)
Compared to:
OK Value
(1.5%)
The regional value is compared to the Oklahoma State value.
US Value
(1.4% in 2021)
The regional value is compared to the national value. The source for the national value is Centers for Disease Control and Prevention
Prior Value
(2.4%)
Prior Value compares a measured value with the previously measured value. Confidence intervals were not taken into account in determining the direction of the comparison.
County: Ottawa Infant Mortality Rate
County: Ottawa Infant Mortality Rate
7.8
Deaths per 1,000 live births
(2018-2020)
Compared to:
OK Counties
(2017-2019)
The distribution is based on data from 42 Oklahoma counties.
OK Value
(6.6)
The regional value is compared to the Oklahoma State value.
US Value
(5.6)
The regional value is compared to the national value. The source for the national value is Centers for Disease Control and Prevention
Prior Value
(6.6)
Prior Value compares a measured value with the previously measured value. Confidence intervals were not taken into account in determining the direction of the comparison.
Trend
This comparison measures the indicator’s values over multiple time periods.<br>The Mann-Kendall Test for Statistical Significance is used to evaluate the trend<br>over 4 to 10 periods of measure, subject to data availability and comparability.
HP 2030 Target
(5.0)
<div>MICH-02: Reduce the rate of infant deaths <strong>(LEADING HEALTH INDICATOR)</strong></div>
County: Ottawa Mothers who Received Early Prenatal Care
County: Ottawa Mothers who Received Early Prenatal Care
69.4%
(2022)
Compared to:
OK Counties
The distribution is based on data from 77 Oklahoma counties.
OK Value
(71.3%)
The regional value is compared to the Oklahoma State value.
US Value
(78.3% in 2021)
The regional value is compared to the national value. The source for the national value is Centers for Disease Control and Prevention
Prior Value
(71.8%)
Prior Value compares a measured value with the previously measured value. Confidence intervals were not taken into account in determining the direction of the comparison.
County: Ottawa Mothers who Smoked During Pregnancy
County: Ottawa Mothers who Smoked During Pregnancy
16.8%
(2022)
Compared to:
OK Counties
The distribution is based on data from 67 Oklahoma counties.
OK Value
(6.6%)
The regional value is compared to the Oklahoma State value.
US Value
(4.6% in 2021)
The regional value is compared to the national value. The source for the national value is Centers for Disease Control and Prevention
Prior Value
(16.7%)
Prior Value compares a measured value with the previously measured value. Confidence intervals were not taken into account in determining the direction of the comparison.
HP 2030 Target
(4.3%)
County: Ottawa Preterm Births
County: Ottawa Preterm Births
12.4%
(2022)
Compared to:
OK Counties
The distribution is based on data from 66 Oklahoma counties.
OK Value
(11.4%)
The regional value is compared to the Oklahoma State value.
US Value
(10.5% in 2021)
The regional value is compared to the national value. The source for the national value is Centers for Disease Control and Prevention
Prior Value
(13.9%)
Prior Value compares a measured value with the previously measured value. Confidence intervals were not taken into account in determining the direction of the comparison.
HP 2030 Target
(9.4%)
Health / Medications & Prescriptions
Health / Medications & Prescriptions
County: Ottawa
Value
Compared to:
County: Ottawa Adults who Bought Medications for Anxiety or Depression
County: Ottawa Adults who Bought Medications for Anxiety or Depression
16.9%
(2023)
Compared to:
OK Value
(16.0%)
The regional value is compared to the Oklahoma State value.
US Value
(14.9%)
The regional value is compared to the national value.
Prior Value
(16.8%)
Prior Value compares a measured value with the previously measured value. Confidence intervals were not taken into account in determining the direction of the comparison.
Health / Mental Health & Mental Disorders
Health / Mental Health & Mental Disorders
County: Ottawa
Value
Compared to:
County: Ottawa Adults Ever Diagnosed with Depression
County: Ottawa Adults Ever Diagnosed with Depression
25.9%
(2021)
Compared to:
OK Counties
The distribution is based on data from 77 Oklahoma counties.
U.S. Counties
The distribution is based on data from 3,074 U.S. counties and county equivalents.
US Value
(19.5%)
The regional value is compared to the national value.
County: Ottawa Age-Adjusted Death Rate due to Suicide
County: Ottawa Age-Adjusted Death Rate due to Suicide
23.8
Deaths per 100,000 population
(2019-2021)
Compared to:
OK Counties
The distribution is based on data from 66 Oklahoma counties.
OK Value
(21.5)
The regional value is compared to the Oklahoma State value.
US Value
(13.5 in 2020)
The regional value is compared to the national value. The source for the national value is Centers for Disease Control and Prevention
HP 2030 Target
(12.8)
<div>MHMD-01: Reduce the suicide rate <strong>(LEADING HEALTH INDICATOR)</strong></div>
County: Ottawa Depression: Medicare Population
County: Ottawa Depression: Medicare Population
16.0%
(2022)
Compared to:
OK Counties
The distribution is based on data from 77 Oklahoma counties.
U.S. Counties
The distribution is based on data from 3,129 U.S. counties and county equivalents.
OK Value
(18.0%)
The regional value is compared to the Oklahoma State value.
US Value
(16.0%)
The regional value is compared to the national value.
Prior Value
(18.0%)
Prior Value compares a measured value with the previously measured value. Confidence intervals were not taken into account in determining the direction of the comparison.
Trend
This comparison measures the indicator’s values over multiple time periods.<br>The Mann-Kendall Test for Statistical Significance is used to evaluate the trend<br>over 4 to 10 periods of measure, subject to data availability and comparability.
County: Ottawa Frequent Mental Distress
County: Ottawa Frequent Mental Distress
18.8%
(2019)
Compared to:
OK Counties
The distribution is based on data from 77 Oklahoma counties.
U.S. Counties
The distribution is based on data from 3,121 U.S. counties and county equivalents.
OK Value
(16.1%)
The regional value is compared to the Oklahoma State value.
US Value
(14.0%)
The regional value is compared to the national value.
Prior Value
(18.9%)
Prior Value compares a measured value with the previously measured value. Confidence intervals were taken into account in determining the direction of the comparison.
County: Ottawa Households that Received Mental Healthcare Services
County: Ottawa Households that Received Mental Healthcare Services
7.6%
(2023)
Compared to:
OK Value
(8.5%)
The regional value is compared to the Oklahoma State value.
US Value
(8.8%)
The regional value is compared to the national value.
Prior Value
(7.2%)
Prior Value compares a measured value with the previously measured value. Confidence intervals were not taken into account in determining the direction of the comparison.
Trend
This comparison measures the indicator’s values over multiple time periods.<br>The Mann-Kendall Test for Statistical Significance is used to evaluate the trend<br>over 4 to 10 periods of measure, subject to data availability and comparability.
County: Ottawa Mental Health Provider Rate
County: Ottawa Mental Health Provider Rate
537
Providers per 100,000 population
(2023)
Compared to:
OK Counties
The distribution is based on data from 71 Oklahoma counties.
U.S. Counties
The distribution is based on data from 2,956 U.S. counties and county equivalents.
OK Value
(426)
The regional value is compared to the Oklahoma State value.
Prior Value
(531)
Prior Value compares a measured value with the previously measured value. Confidence intervals were not taken into account in determining the direction of the comparison.
Trend
This comparison measures the indicator’s values over multiple time periods.<br>The Mann-Kendall Test for Statistical Significance is used to evaluate the trend<br>over 4 to 10 periods of measure, subject to data availability and comparability.
County: Ottawa Poor Mental Health: 14+ Days
County: Ottawa Poor Mental Health: 14+ Days
19.5%
(2021)
Compared to:
OK Counties
The distribution is based on data from 77 Oklahoma counties.
U.S. Counties
The distribution is based on data from 3,074 U.S. counties and county equivalents.
US Value
(14.7%)
The regional value is compared to the national value.
County: Ottawa Poor Mental Health: Average Number of Days
County: Ottawa Poor Mental Health: Average Number of Days
6.1
Days
(2021)
Compared to:
OK Counties
The distribution is based on data from 77 Oklahoma counties.
U.S. Counties
The distribution is based on data from 3,141 U.S. counties and county equivalents.
OK Value
(5.5)
The regional value is compared to the Oklahoma State value.
US Value
(4.8)
The regional value is compared to the national value.
Prior Value
(5.8)
Prior Value compares a measured value with the previously measured value. Confidence intervals were taken into account in determining the direction of the comparison.
Trend
This comparison measures the indicator’s values over multiple time periods.<br>The Mann-Kendall Test for Statistical Significance is used to evaluate the trend<br>over 4 to 10 periods of measure, subject to data availability and comparability.
Health / Mortality Data
Health / Mortality Data
County: Ottawa
Value
Compared to:
County: Ottawa Life Expectancy
County: Ottawa Life Expectancy
70.6
Years
(2019-2021)
Compared to:
OK Counties
The distribution is based on data from 77 Oklahoma counties.
U.S. Counties
The distribution is based on data from 3,070 U.S. counties and county equivalents.
OK Value
(74.4)
The regional value is compared to the Oklahoma State value.
US Value
(77.6)
The regional value is compared to the national value.
County: Ottawa Premature Death
County: Ottawa Premature Death
14,261.0
Years per 100,000 population
(2019-2021)
Compared to:
OK Counties
The distribution is based on data from 75 Oklahoma counties.
U.S. Counties
The distribution is based on data from 2,886 U.S. counties and county equivalents.
OK Value
(10,334.0)
The regional value is compared to the Oklahoma State value.
US Value
(7,971.5)
The regional value is compared to the national value.
Health / Nutrition & Healthy Eating
Health / Nutrition & Healthy Eating
County: Ottawa
Value
Compared to:
County: Ottawa Adults who Drank Soft Drinks: Past 7 Days
County: Ottawa Adults who Drank Soft Drinks: Past 7 Days
49.2%
(2023)
Compared to:
OK Counties
The distribution is based on data from 77 Oklahoma counties.
OK Value
(46.8%)
The regional value is compared to the Oklahoma State value.
US Value
(43.7%)
The regional value is compared to the national value.
County: Ottawa Adults who Frequently Cook Meals at Home
County: Ottawa Adults who Frequently Cook Meals at Home
76.0%
(2023)
Compared to:
OK Counties
The distribution is based on data from 77 Oklahoma counties.
OK Value
(76.4%)
The regional value is compared to the Oklahoma State value.
US Value
(78.0%)
The regional value is compared to the national value.
Prior Value
(65.0%)
Prior Value compares a measured value with the previously measured value. Confidence intervals were not taken into account in determining the direction of the comparison.
38.1%
(2023)
Compared to:
OK Counties
The distribution is based on data from 77 Oklahoma counties.
U.S. Counties
The distribution is based on data from 3,141 U.S. counties and county equivalents.
OK Value
(40.8%)
The regional value is compared to the Oklahoma State value.
US Value
(40.4%)
The regional value is compared to the national value.
Prior Value
(38.6%)
Prior Value compares a measured value with the previously measured value. Confidence intervals were not taken into account in determining the direction of the comparison.
Trend
This comparison measures the indicator’s values over multiple time periods.<br>The Mann-Kendall Test for Statistical Significance is used to evaluate the trend<br>over 4 to 10 periods of measure, subject to data availability and comparability.
Health / Older Adults
Health / Older Adults
County: Ottawa
Value
Compared to:
32.0%
(2020)
Compared to:
OK Counties
The distribution is based on data from 77 Oklahoma counties.
U.S. Counties
The distribution is based on data from 3,141 U.S. counties and county equivalents.
US Value
(37.9%)
The regional value is compared to the national value.
41.7%
(2020)
Compared to:
OK Counties
The distribution is based on data from 77 Oklahoma counties.
U.S. Counties
The distribution is based on data from 3,141 U.S. counties and county equivalents.
US Value
(43.7%)
The regional value is compared to the national value.
County: Ottawa Adults 65+ with a Disability
County: Ottawa Adults 65+ with a Disability
43.5%
(2018-2022)
Compared to:
OK Value
(41.0%)
The regional value is compared to the Oklahoma State value.
US Value
(33.3%)
The regional value is compared to the national value.
Trend
This comparison measures the indicator’s values over multiple time periods.<br>The Mann-Kendall Test for Statistical Significance is used to evaluate the trend<br>over 4 to 10 periods of measure, subject to data availability and comparability.
County: Ottawa Adults 65+ with a Hearing Difficulty
County: Ottawa Adults 65+ with a Hearing Difficulty
22.3%
(2018-2022)
Compared to:
OK Value
(18.9%)
The regional value is compared to the Oklahoma State value.
US Value
(13.7%)
The regional value is compared to the national value.
Trend
This comparison measures the indicator’s values over multiple time periods.<br>The Mann-Kendall Test for Statistical Significance is used to evaluate the trend<br>over 4 to 10 periods of measure, subject to data availability and comparability.
County: Ottawa Adults 65+ with a Self-Care Difficulty
County: Ottawa Adults 65+ with a Self-Care Difficulty
6.5%
(2018-2022)
Compared to:
OK Value
(7.6%)
The regional value is compared to the Oklahoma State value.
US Value
(7.4%)
The regional value is compared to the national value.
Trend
This comparison measures the indicator’s values over multiple time periods.<br>The Mann-Kendall Test for Statistical Significance is used to evaluate the trend<br>over 4 to 10 periods of measure, subject to data availability and comparability.
County: Ottawa Adults 65+ with a Vision Difficulty
County: Ottawa Adults 65+ with a Vision Difficulty
10.2%
(2018-2022)
Compared to:
OK Value
(8.1%)
The regional value is compared to the Oklahoma State value.
US Value
(6.0%)
The regional value is compared to the national value.
Trend
This comparison measures the indicator’s values over multiple time periods.<br>The Mann-Kendall Test for Statistical Significance is used to evaluate the trend<br>over 4 to 10 periods of measure, subject to data availability and comparability.
County: Ottawa Adults 65+ with an Independent Living Difficulty
County: Ottawa Adults 65+ with an Independent Living Difficulty
13.6%
(2018-2022)
Compared to:
OK Value
(14.4%)
The regional value is compared to the Oklahoma State value.
US Value
(13.6%)
The regional value is compared to the national value.
Trend
This comparison measures the indicator’s values over multiple time periods.<br>The Mann-Kendall Test for Statistical Significance is used to evaluate the trend<br>over 4 to 10 periods of measure, subject to data availability and comparability.
County: Ottawa Age-Adjusted Death Rate due to Alzheimer's Disease
County: Ottawa Age-Adjusted Death Rate due to Alzheimer's Disease
43.8
Deaths per 100,000 population
(2019-2021)
Compared to:
OK Counties
The distribution is based on data from 71 Oklahoma counties.
OK Value
(37.4)
The regional value is compared to the Oklahoma State value.
US Value
(32.4 in 2020)
The regional value is compared to the national value. The source for the national value is Centers for Disease Control and Prevention
County: Ottawa Alzheimer's Disease or Dementia: Medicare Population
County: Ottawa Alzheimer's Disease or Dementia: Medicare Population
6.0%
(2022)
Compared to:
OK Counties
The distribution is based on data from 77 Oklahoma counties.
U.S. Counties
The distribution is based on data from 3,129 U.S. counties and county equivalents.
OK Value
(7.0%)
The regional value is compared to the Oklahoma State value.
US Value
(6.0%)
The regional value is compared to the national value.
Prior Value
(6.0%)
Prior Value compares a measured value with the previously measured value. Confidence intervals were not taken into account in determining the direction of the comparison.
Trend
This comparison measures the indicator’s values over multiple time periods.<br>The Mann-Kendall Test for Statistical Significance is used to evaluate the trend<br>over 4 to 10 periods of measure, subject to data availability and comparability.
Health / Oral Health
Health / Oral Health
County: Ottawa
Value
Compared to:
County: Ottawa Adults 65+ with Total Tooth Loss
County: Ottawa Adults 65+ with Total Tooth Loss
17.8%
(2020)
Compared to:
OK Counties
The distribution is based on data from 77 Oklahoma counties.
U.S. Counties
The distribution is based on data from 3,141 U.S. counties and county equivalents.
US Value
(13.4%)
The regional value is compared to the national value.
County: Ottawa Adults who Visited a Dentist
County: Ottawa Adults who Visited a Dentist
40.6%
(2023)
Compared to:
OK Counties
The distribution is based on data from 77 Oklahoma counties.
U.S. Counties
The distribution is based on data from 3,141 U.S. counties and county equivalents.
OK Value
(46.5%)
The regional value is compared to the Oklahoma State value.
US Value
(51.2%)
The regional value is compared to the national value.
Prior Value
(42.3%)
Prior Value compares a measured value with the previously measured value. Confidence intervals were not taken into account in determining the direction of the comparison.
Trend
This comparison measures the indicator’s values over multiple time periods.<br>The Mann-Kendall Test for Statistical Significance is used to evaluate the trend<br>over 4 to 10 periods of measure, subject to data availability and comparability.
County: Ottawa Dentist Rate
County: Ottawa Dentist Rate
17
Dentists per 100,000 population
(2022)
Compared to:
OK Counties
The distribution is based on data from 74 Oklahoma counties.
U.S. Counties
The distribution is based on data from 3,054 U.S. counties and county equivalents.
OK Value
(64)
The regional value is compared to the Oklahoma State value.
Prior Value
(23)
Prior Value compares a measured value with the previously measured value. Confidence intervals were not taken into account in determining the direction of the comparison.
Trend
This comparison measures the indicator’s values over multiple time periods.<br>The Mann-Kendall Test for Statistical Significance is used to evaluate the trend<br>over 4 to 10 periods of measure, subject to data availability and comparability.
Health / Other Conditions
Health / Other Conditions
County: Ottawa
Value
Compared to:
County: Ottawa Adults Who Visited a Dermatologist
County: Ottawa Adults Who Visited a Dermatologist
11.3%
(2023)
Compared to:
OK Value
(13.4%)
The regional value is compared to the Oklahoma State value.
US Value
(15.9%)
The regional value is compared to the national value.
Prior Value
(12.4%)
Prior Value compares a measured value with the previously measured value. Confidence intervals were not taken into account in determining the direction of the comparison.
Trend
This comparison measures the indicator’s values over multiple time periods.<br>The Mann-Kendall Test for Statistical Significance is used to evaluate the trend<br>over 4 to 10 periods of measure, subject to data availability and comparability.
County: Ottawa Adults with Arthritis
County: Ottawa Adults with Arthritis
30.6%
(2021)
Compared to:
OK Counties
The distribution is based on data from 77 Oklahoma counties.
U.S. Counties
The distribution is based on data from 3,074 U.S. counties and county equivalents.
US Value
(25.2%)
The regional value is compared to the national value.
County: Ottawa Adults with Kidney Disease
County: Ottawa Adults with Kidney Disease
3.9%
(2021)
Compared to:
OK Counties
The distribution is based on data from 77 Oklahoma counties.
U.S. Counties
The distribution is based on data from 3,074 U.S. counties and county equivalents.
US Value
(3.1%)
The regional value is compared to the national value.
County: Ottawa Age-Adjusted Death Rate due to Kidney Disease
County: Ottawa Age-Adjusted Death Rate due to Kidney Disease
13.9
Deaths per 100,000 population
(2019-2021)
Compared to:
OK Counties
The distribution is based on data from 63 Oklahoma counties.
OK Value
(11.3)
The regional value is compared to the Oklahoma State value.
US Value
(12.7 in 2020)
The regional value is compared to the national value. The source for the national value is Centers for Disease Control and Prevention
County: Ottawa Chronic Kidney Disease: Medicare Population
County: Ottawa Chronic Kidney Disease: Medicare Population
21.0%
(2022)
Compared to:
OK Counties
The distribution is based on data from 77 Oklahoma counties.
U.S. Counties
The distribution is based on data from 3,129 U.S. counties and county equivalents.
OK Value
(19.0%)
The regional value is compared to the Oklahoma State value.
US Value
(18.0%)
The regional value is compared to the national value.
Prior Value
(21.0%)
Prior Value compares a measured value with the previously measured value. Confidence intervals were not taken into account in determining the direction of the comparison.
Trend
This comparison measures the indicator’s values over multiple time periods.<br>The Mann-Kendall Test for Statistical Significance is used to evaluate the trend<br>over 4 to 10 periods of measure, subject to data availability and comparability.
County: Ottawa Osteoporosis: Medicare Population
County: Ottawa Osteoporosis: Medicare Population
8.0%
(2022)
Compared to:
OK Counties
The distribution is based on data from 77 Oklahoma counties.
U.S. Counties
The distribution is based on data from 3,129 U.S. counties and county equivalents.
OK Value
(10.0%)
The regional value is compared to the Oklahoma State value.
US Value
(11.0%)
The regional value is compared to the national value.
Prior Value
(8.0%)
Prior Value compares a measured value with the previously measured value. Confidence intervals were not taken into account in determining the direction of the comparison.
Trend
This comparison measures the indicator’s values over multiple time periods.<br>The Mann-Kendall Test for Statistical Significance is used to evaluate the trend<br>over 4 to 10 periods of measure, subject to data availability and comparability.
County: Ottawa Rheumatoid Arthritis or Osteoarthritis: Medicare Population
County: Ottawa Rheumatoid Arthritis or Osteoarthritis: Medicare Population
37.0%
(2022)
Compared to:
OK Counties
The distribution is based on data from 77 Oklahoma counties.
U.S. Counties
The distribution is based on data from 3,129 U.S. counties and county equivalents.
OK Value
(38.0%)
The regional value is compared to the Oklahoma State value.
US Value
(35.0%)
The regional value is compared to the national value.
Prior Value
(39.0%)
Prior Value compares a measured value with the previously measured value. Confidence intervals were not taken into account in determining the direction of the comparison.
Trend
This comparison measures the indicator’s values over multiple time periods.<br>The Mann-Kendall Test for Statistical Significance is used to evaluate the trend<br>over 4 to 10 periods of measure, subject to data availability and comparability.
Health / Physical Activity
Health / Physical Activity
County: Ottawa
Value
Compared to:
County: Ottawa Adults 20+ who are Sedentary
County: Ottawa Adults 20+ who are Sedentary
27.1%
(2021)
Compared to:
OK Counties
The distribution is based on data from 77 Oklahoma counties.
U.S. Counties
The distribution is based on data from 3,074 U.S. counties and county equivalents.
Prior Value
(25.0%)
Prior Value compares a measured value with the previously measured value. Confidence intervals were taken into account in determining the direction of the comparison.
Trend
This comparison measures the indicator’s values over multiple time periods.<br>The Mann-Kendall Test for Statistical Significance is used to evaluate the trend<br>over 4 to 10 periods of measure, subject to data availability and comparability.
County: Ottawa Adults Who Belong to a Fitness Club or Gym
County: Ottawa Adults Who Belong to a Fitness Club or Gym
8.1%
(2023)
Compared to:
OK Value
(13.1%)
The regional value is compared to the Oklahoma State value.
US Value
(16.0%)
The regional value is compared to the national value.
Prior Value
(9.4%)
Prior Value compares a measured value with the previously measured value. Confidence intervals were not taken into account in determining the direction of the comparison.
County: Ottawa Adults who Follow a Regular Exercise Routine
County: Ottawa Adults who Follow a Regular Exercise Routine
59.6%
(2023)
Compared to:
OK Counties
The distribution is based on data from 77 Oklahoma counties.
OK Value
(63.3%)
The regional value is compared to the Oklahoma State value.
US Value
(67.2%)
The regional value is compared to the national value.
Prior Value
(43.2%)
Prior Value compares a measured value with the previously measured value. Confidence intervals were not taken into account in determining the direction of the comparison.
Health / Prevention & Safety
Health / Prevention & Safety
County: Ottawa
Value
Compared to:
County: Ottawa Age-Adjusted Death Rate due to Falls
County: Ottawa Age-Adjusted Death Rate due to Falls
8.5
Deaths per 100,000 population
(2019-2021)
Compared to:
OK Counties
The distribution is based on data from 65 Oklahoma counties.
OK Value
(16.6)
The regional value is compared to the Oklahoma State value.
US Value
(10.3 in 2020)
The regional value is compared to the national value. The source for the national value is Centers for Disease Control and Prevention
County: Ottawa Age-Adjusted Death Rate due to Firearms
County: Ottawa Age-Adjusted Death Rate due to Firearms
22.7
Deaths per 100,000 population
(2017-2019)
Compared to:
U.S. Counties
The distribution is based on data from 1,080 U.S. counties and county equivalents.
OK Value
(17.1)
The regional value is compared to the Oklahoma State value.
US Value
(11.5)
The regional value is compared to the national value.
HP 2030 Target
(10.7)
County: Ottawa Age-Adjusted Death Rate due to Unintentional Injuries
County: Ottawa Age-Adjusted Death Rate due to Unintentional Injuries
90.0
Deaths per 100,000 population
(2019-2021)
Compared to:
OK Counties
The distribution is based on data from 76 Oklahoma counties.
OK Value
(64.7)
The regional value is compared to the Oklahoma State value.
US Value
(57.6 in 2020)
The regional value is compared to the national value. The source for the national value is Centers for Disease Control and Prevention
HP 2030 Target
(43.2)
Health / Respiratory Diseases
Health / Respiratory Diseases
County: Ottawa
Value
Compared to:
County: Ottawa Adults Who Bought Medications for Asthma
County: Ottawa Adults Who Bought Medications for Asthma
7.2%
(2023)
Compared to:
OK Value
(7.0%)
The regional value is compared to the Oklahoma State value.
US Value
(6.6%)
The regional value is compared to the national value.
Prior Value
(7.1%)
Prior Value compares a measured value with the previously measured value. Confidence intervals were not taken into account in determining the direction of the comparison.
Trend
This comparison measures the indicator’s values over multiple time periods.<br>The Mann-Kendall Test for Statistical Significance is used to evaluate the trend<br>over 4 to 10 periods of measure, subject to data availability and comparability.
County: Ottawa Adults with COPD
County: Ottawa Adults with COPD
10.4%
Percent of adults
(2021)
Compared to:
OK Counties
The distribution is based on data from 77 Oklahoma counties.
U.S. Counties
The distribution is based on data from 3,074 U.S. counties and county equivalents.
US Value
(6.4%)
The regional value is compared to the national value.
County: Ottawa Adults with Current Asthma
County: Ottawa Adults with Current Asthma
12.2%
(2021)
Compared to:
OK Counties
The distribution is based on data from 77 Oklahoma counties.
U.S. Counties
The distribution is based on data from 3,074 U.S. counties and county equivalents.
US Value
(9.7%)
The regional value is compared to the national value.
83.8
Deaths per 100,000 population
(2019-2021)
Compared to:
OK Counties
The distribution is based on data from 77 Oklahoma counties.
OK Value
(60.9)
The regional value is compared to the Oklahoma State value.
US Value
(36.4 in 2020)
The regional value is compared to the national value. The source for the national value is Centers for Disease Control and Prevention
County: Ottawa Asthma: Medicare Population
County: Ottawa Asthma: Medicare Population
6.0%
(2022)
Compared to:
OK Counties
The distribution is based on data from 77 Oklahoma counties.
U.S. Counties
The distribution is based on data from 3,129 U.S. counties and county equivalents.
OK Value
(7.0%)
The regional value is compared to the Oklahoma State value.
US Value
(7.0%)
The regional value is compared to the national value.
Prior Value
(6.0%)
Prior Value compares a measured value with the previously measured value. Confidence intervals were not taken into account in determining the direction of the comparison.
Trend
This comparison measures the indicator’s values over multiple time periods.<br>The Mann-Kendall Test for Statistical Significance is used to evaluate the trend<br>over 4 to 10 periods of measure, subject to data availability and comparability.
County: Ottawa COPD: Medicare Population
County: Ottawa COPD: Medicare Population
18.0%
(2022)
Compared to:
OK Counties
The distribution is based on data from 77 Oklahoma counties.
U.S. Counties
The distribution is based on data from 3,129 U.S. counties and county equivalents.
OK Value
(14.0%)
The regional value is compared to the Oklahoma State value.
US Value
(11.0%)
The regional value is compared to the national value.
Prior Value
(20.0%)
Prior Value compares a measured value with the previously measured value. Confidence intervals were not taken into account in determining the direction of the comparison.
Trend
This comparison measures the indicator’s values over multiple time periods.<br>The Mann-Kendall Test for Statistical Significance is used to evaluate the trend<br>over 4 to 10 periods of measure, subject to data availability and comparability.
Health / Sexually Transmitted Infections
Health / Sexually Transmitted Infections
County: Ottawa
Value
Compared to:
County: Ottawa Chlamydia Incidence Rate
County: Ottawa Chlamydia Incidence Rate
626.2
Cases per 100,000 population
(2021)
Compared to:
OK Counties
The distribution is based on data from 77 Oklahoma counties.
U.S. Counties
The distribution is based on data from 2,800 U.S. counties and county equivalents.
OK Value
(519.5)
The regional value is compared to the Oklahoma State value.
US Value
(495.5)
The regional value is compared to the national value.
Prior Value
(533.3)
Prior Value compares a measured value with the previously measured value. Confidence intervals were not taken into account in determining the direction of the comparison.
Trend
This comparison measures the indicator’s values over multiple time periods.<br>The Mann-Kendall Test for Statistical Significance is used to evaluate the trend<br>over 4 to 10 periods of measure, subject to data availability and comparability.
County: Ottawa Gonorrhea Incidence Rate
County: Ottawa Gonorrhea Incidence Rate
395.5
Cases per 100,000 population
(2021)
Compared to:
OK Counties
The distribution is based on data from 77 Oklahoma counties.
U.S. Counties
The distribution is based on data from 3,117 U.S. counties and county equivalents.
OK Value
(257.7)
The regional value is compared to the Oklahoma State value.
US Value
(214.0)
The regional value is compared to the national value.
Prior Value
(228.1)
Prior Value compares a measured value with the previously measured value. Confidence intervals were not taken into account in determining the direction of the comparison.
Trend
This comparison measures the indicator’s values over multiple time periods.<br>The Mann-Kendall Test for Statistical Significance is used to evaluate the trend<br>over 4 to 10 periods of measure, subject to data availability and comparability.
County: Ottawa HIV Prevalence Rate
County: Ottawa HIV Prevalence Rate
64.5
Cases per 100,000 population
(2021)
Compared to:
OK Value
(210.2)
The regional value is compared to the Oklahoma State value.
US Value
(382.2)
The regional value is compared to the national value.
Prior Value
(71.1)
Prior Value compares a measured value with the previously measured value. Confidence intervals were not taken into account in determining the direction of the comparison.
Trend
This comparison measures the indicator’s values over multiple time periods.<br>The Mann-Kendall Test for Statistical Significance is used to evaluate the trend<br>over 4 to 10 periods of measure, subject to data availability and comparability.
County: Ottawa Syphilis Incidence Rate
County: Ottawa Syphilis Incidence Rate
39.6
Cases per 100,000 population
(2021)
Compared to:
OK Counties
The distribution is based on data from 77 Oklahoma counties.
OK Value
(30.7)
The regional value is compared to the Oklahoma State value.
US Value
(16.2)
The regional value is compared to the national value.
Prior Value
(22.5)
Prior Value compares a measured value with the previously measured value. Confidence intervals were not taken into account in determining the direction of the comparison.
Trend
This comparison measures the indicator’s values over multiple time periods.<br>The Mann-Kendall Test for Statistical Significance is used to evaluate the trend<br>over 4 to 10 periods of measure, subject to data availability and comparability.
Health / Tobacco Use
Health / Tobacco Use
County: Ottawa
Value
Compared to:
County: Ottawa Adults Who Bought Medications to Quit Smoking
County: Ottawa Adults Who Bought Medications to Quit Smoking
1.6%
(2023)
Compared to:
OK Value
(1.5%)
The regional value is compared to the Oklahoma State value.
US Value
(1.4%)
The regional value is compared to the national value.
Prior Value
(1.6%)
Prior Value compares a measured value with the previously measured value. Confidence intervals were not taken into account in determining the direction of the comparison.
Trend
This comparison measures the indicator’s values over multiple time periods.<br>The Mann-Kendall Test for Statistical Significance is used to evaluate the trend<br>over 4 to 10 periods of measure, subject to data availability and comparability.
County: Ottawa Adults who Smoke
County: Ottawa Adults who Smoke
22.8%
(2023)
Compared to:
OK Counties
The distribution is based on data from 77 Oklahoma counties.
U.S. Counties
The distribution is based on data from 3,141 U.S. counties and county equivalents.
OK Value
(18.7%)
The regional value is compared to the Oklahoma State value.
US Value
(15.5%)
The regional value is compared to the national value.
Prior Value
(22.6%)
Prior Value compares a measured value with the previously measured value. Confidence intervals were not taken into account in determining the direction of the comparison.
Trend
This comparison measures the indicator’s values over multiple time periods.<br>The Mann-Kendall Test for Statistical Significance is used to evaluate the trend<br>over 4 to 10 periods of measure, subject to data availability and comparability.
HP 2030 Target
(6.1%)
<div>TU-02: Reduce current cigarette smoking in adults <strong>(LEADING HEALTH INDICATOR)</strong></div>
County: Ottawa Adults Who Used Electronic Cigarettes: Past 30 Days
County: Ottawa Adults Who Used Electronic Cigarettes: Past 30 Days
6.7%
(2023)
Compared to:
OK Counties
The distribution is based on data from 77 Oklahoma counties.
U.S. Counties
The distribution is based on data from 3,141 U.S. counties and county equivalents.
OK Value
(6.5%)
The regional value is compared to the Oklahoma State value.
US Value
(5.9%)
The regional value is compared to the national value.
County: Ottawa Adults Who Used Smokeless Tobacco: Past 30 Days
County: Ottawa Adults Who Used Smokeless Tobacco: Past 30 Days
3.1%
(2023)
Compared to:
OK Counties
The distribution is based on data from 77 Oklahoma counties.
U.S. Counties
The distribution is based on data from 3,141 U.S. counties and county equivalents.
OK Value
(2.3%)
The regional value is compared to the Oklahoma State value.
US Value
(1.7%)
The regional value is compared to the national value.
Prior Value
(3.3%)
Prior Value compares a measured value with the previously measured value. Confidence intervals were not taken into account in determining the direction of the comparison.
Trend
This comparison measures the indicator’s values over multiple time periods.<br>The Mann-Kendall Test for Statistical Significance is used to evaluate the trend<br>over 4 to 10 periods of measure, subject to data availability and comparability.
Health / Weight Status
Health / Weight Status
County: Ottawa
Value
Compared to:
County: Ottawa Adults 20+ Who Are Obese
County: Ottawa Adults 20+ Who Are Obese
31.0%
(2021)
Compared to:
OK Counties
The distribution is based on data from 77 Oklahoma counties.
U.S. Counties
The distribution is based on data from 3,074 U.S. counties and county equivalents.
Prior Value
(31.5%)
Prior Value compares a measured value with the previously measured value. Confidence intervals were taken into account in determining the direction of the comparison.
Trend
This comparison measures the indicator’s values over multiple time periods.<br>The Mann-Kendall Test for Statistical Significance is used to evaluate the trend<br>over 4 to 10 periods of measure, subject to data availability and comparability.
HP 2030 Target
(36.0%)
County: Ottawa Adults Happy with Weight
County: Ottawa Adults Happy with Weight
44.4%
(2023)
Compared to:
OK Counties
The distribution is based on data from 77 Oklahoma counties.
OK Value
(46.4%)
The regional value is compared to the Oklahoma State value.
US Value
(48.7%)
The regional value is compared to the national value.
Prior Value
(45.3%)
Prior Value compares a measured value with the previously measured value. Confidence intervals were not taken into account in determining the direction of the comparison.
Health / Wellness & Lifestyle
Health / Wellness & Lifestyle
County: Ottawa
Value
Compared to:
County: Ottawa Adults who Agree Vaccine Benefits Outweigh Possible Risks
County: Ottawa Adults who Agree Vaccine Benefits Outweigh Possible Risks
61.8%
(2023)
Compared to:
OK Counties
The distribution is based on data from 77 Oklahoma counties.
U.S. Counties
The distribution is based on data from 3,141 U.S. counties and county equivalents.
OK Value
(65.8%)
The regional value is compared to the Oklahoma State value.
US Value
(70.1%)
The regional value is compared to the national value.
Prior Value
(65.0%)
Prior Value compares a measured value with the previously measured value. Confidence intervals were not taken into account in determining the direction of the comparison.
