The 2023 Mental Health Index, created by Conduent Healthy Communities Institute, is a measure of socioeconomic and health factors correlated with self-reported poor mental health. The index is part of Conduent's SocioNeeds Index® Suite, which provides analytics around social determinants of health to advance equitable outcomes for a range of topics.
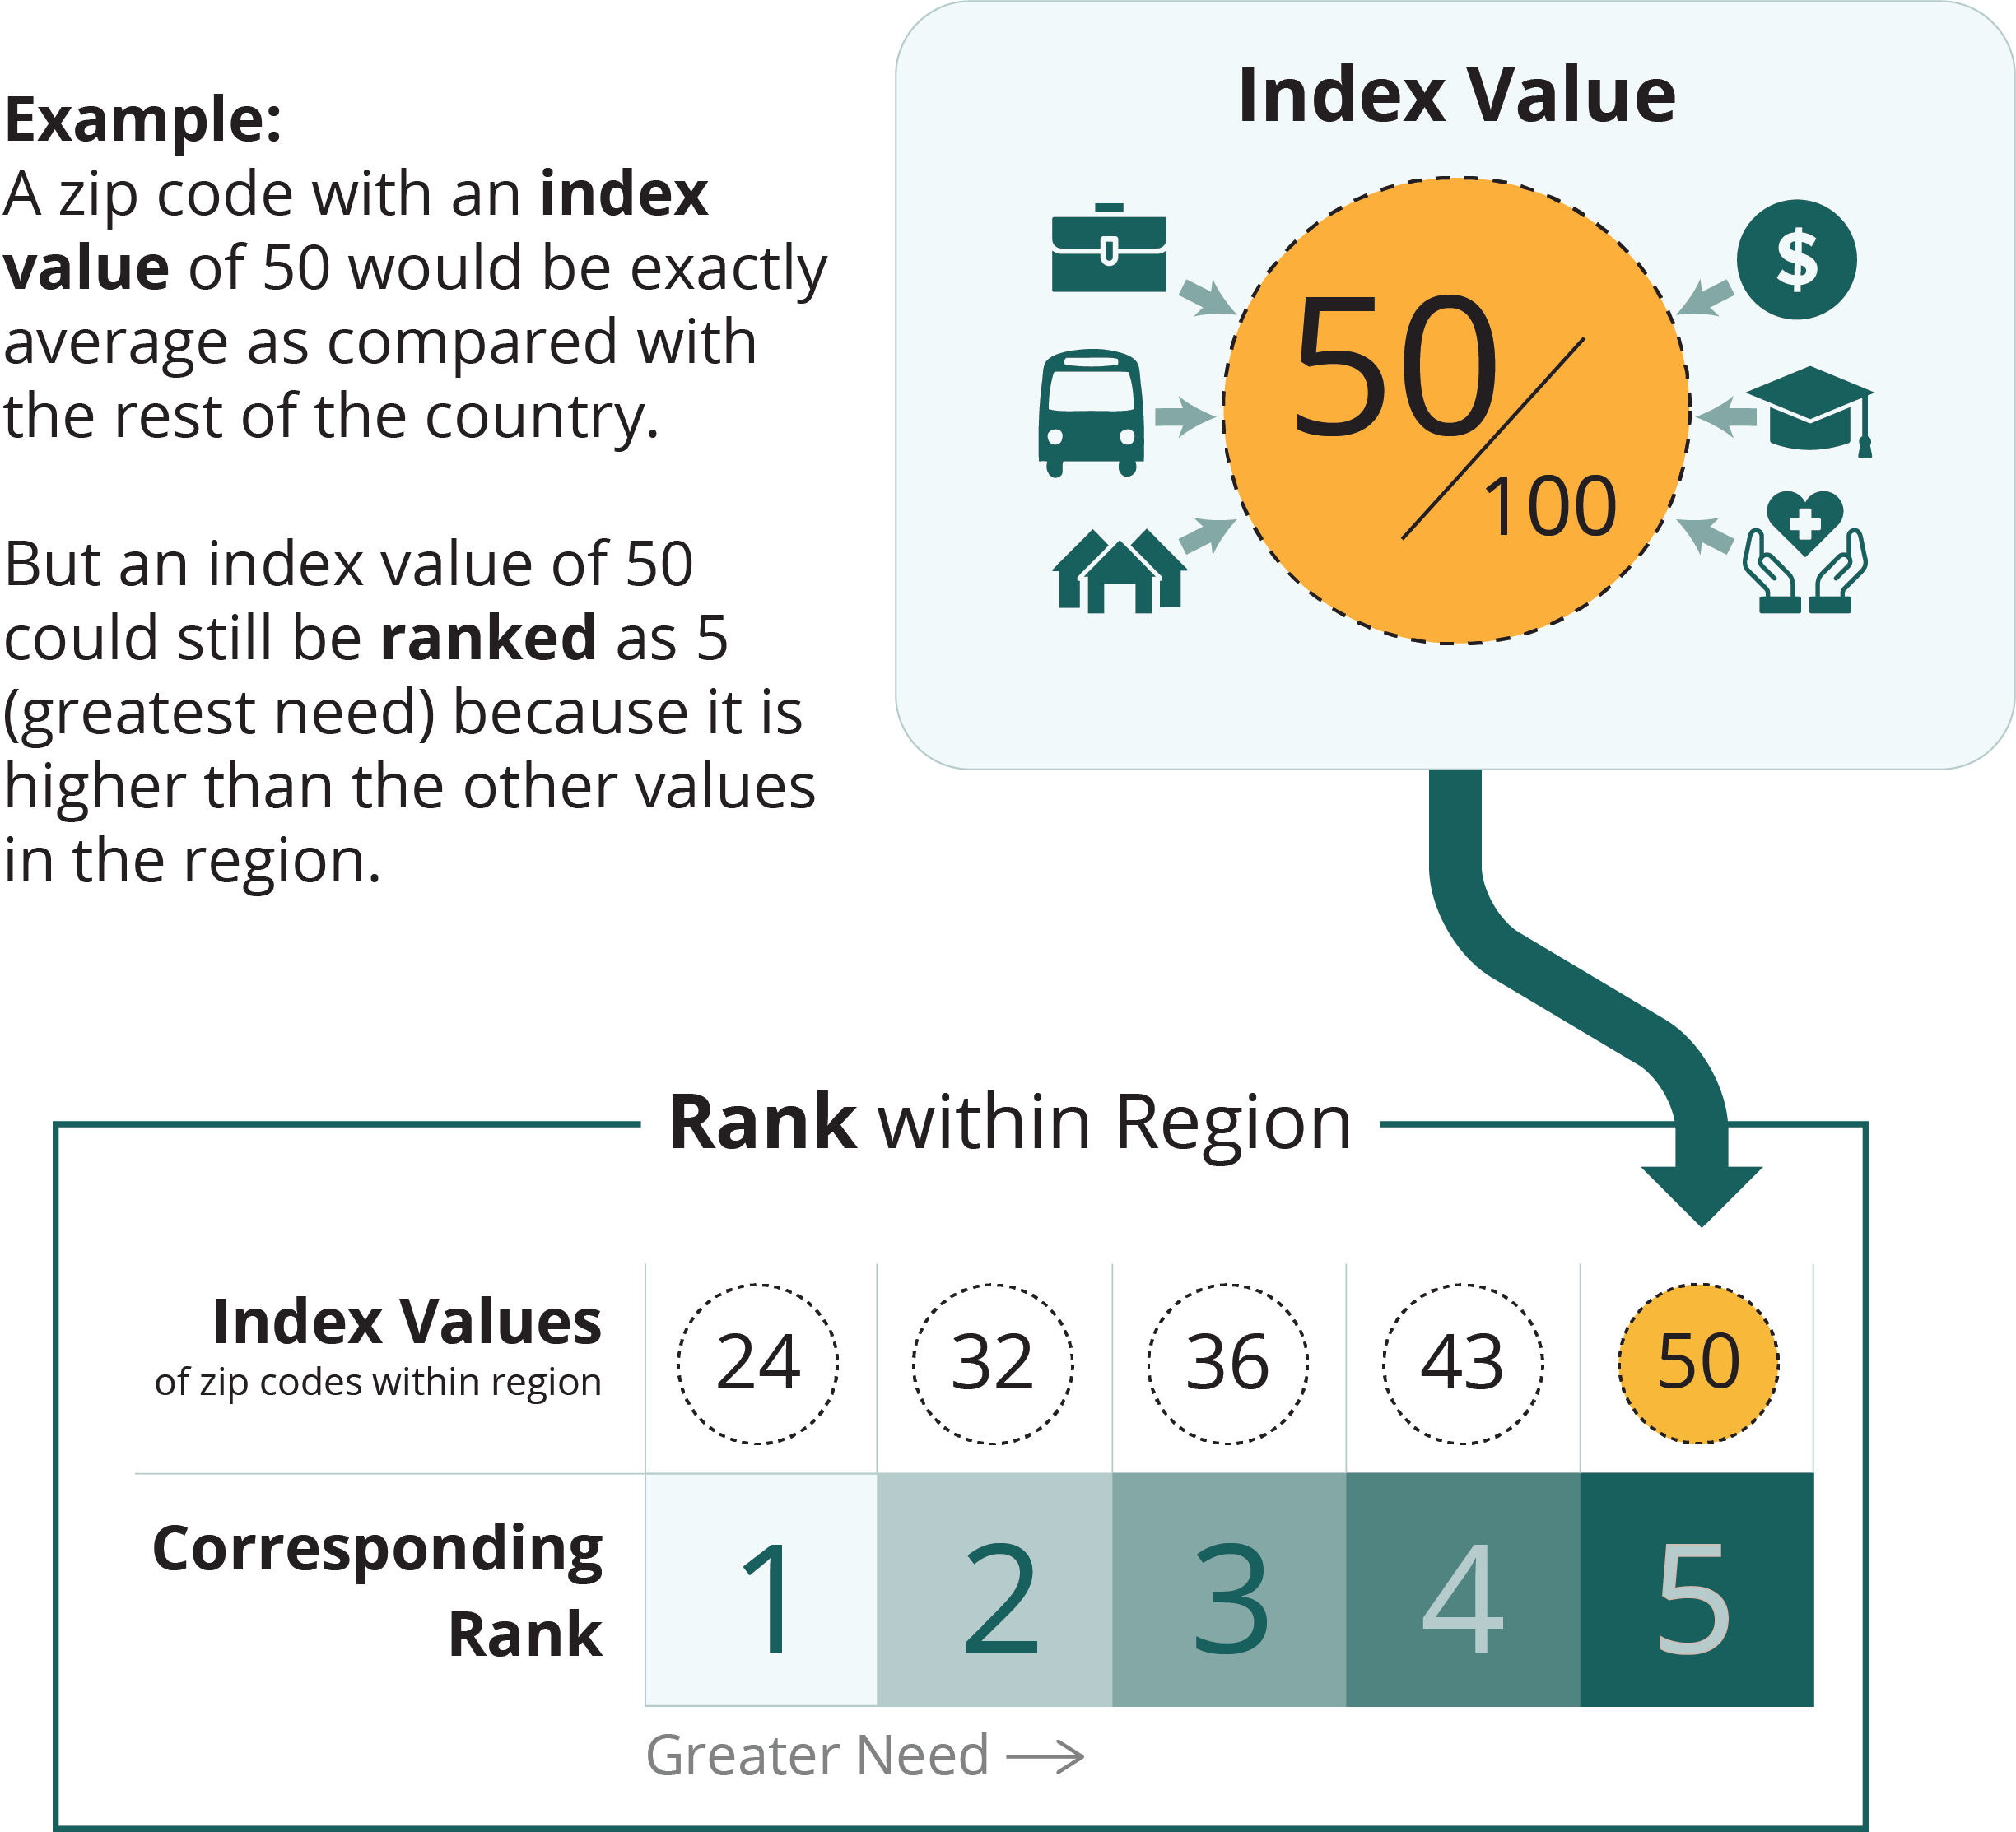
All zip codes, counties, and county equivalents in the United States are given an index value from 0 (low need) to 100 (high need). To help you find the areas of highest need in your community, the selected locations are ranked from 1 (low need) to 5 (high need) based on their index value relative to similar locations within the region.

map legend
greater need
1
2
3
4
5


| Zip Codesort column | Indexsort column | Ranksort column | Countysort column |
|---|---|---|---|
| 74106 | 99.4 | 5 | Tulsa |
| 74401 | 98.2 | 5 | Muskogee |
| 74126 | 97.8 | 5 | Tulsa |
| 74130 | 95.9 | 5 | Tulsa |
| 74467 | 95.8 | 5 | Wagoner |
| 74464 | 95.0 | 5 | Cherokee |
| 74127 | 94.7 | 5 | Tulsa |
| 74962 | 94.5 | 5 | Sequoyah |
| 74110 | 94.4 | 5 | Tulsa |
| 74441 | 93.4 | 5 | Cherokee |
| 74107 | 92.0 | 5 | Tulsa |
| 74435 | 91.9 | 5 | Sequoyah |
| 74955 | 91.8 | 5 | Sequoyah |
| 74003 | 91.7 | 5 | Washington |
| 74115 | 90.8 | 5 | Tulsa |
| 74344 | 90.7 | 5 | Delaware |
| 74301 | 90.2 | 5 | Craig |
| 74331 | 89.2 | 5 | Delaware |
| 74347 | 88.8 | 5 | Delaware |
| 74136 | 88.4 | 5 | Tulsa |
| 74361 | 88.4 | 5 | Mayes |
| 74352 | 87.9 | 5 | Mayes |
| 74403 | 87.8 | 5 | Muskogee |
| 74346 | 87.5 | 5 | Delaware |
| 74426 | 87.0 | 5 | McIntosh |
| 74451 | 86.0 | 4 | Cherokee |
| 74960 | 85.8 | 4 | Adair |
| 74965 | 85.7 | 4 | Adair |
| 74135 | 85.6 | 4 | Tulsa |
| 74354 | 85.5 | 4 | Ottawa |
| 74112 | 85.2 | 4 | Tulsa |
| 74432 | 84.6 | 4 | McIntosh |
| 74108 | 84.5 | 4 | Tulsa |
| 74342 | 84.1 | 4 | Delaware |
| 74457 | 83.8 | 4 | Adair |
| 74016 | 83.6 | 4 | Rogers |
| 74366 | 83.6 | 4 | Mayes |
| 74339 | 83.1 | 4 | Ottawa |
| 74470 | 82.6 | 4 | Muskogee |
| 74365 | 81.5 | 4 | Mayes |
| 74368 | 81.3 | 4 | Delaware |
| 74105 | 81.0 | 4 | Tulsa |
| 74048 | 80.7 | 4 | Nowata |
| 74343 | 80.4 | 4 | Ottawa |
| 74337 | 80.1 | 4 | Mayes |
| 74129 | 79.8 | 4 | Tulsa |
| 74454 | 79.2 | 4 | Wagoner |
| 74017 | 79.0 | 4 | Rogers |
| 74422 | 78.4 | 4 | Muskogee |
| 74116 | 78.2 | 4 | Tulsa |
| 74128 | 77.5 | 4 | Tulsa |
| 74948 | 77.2 | 4 | Sequoyah |
| 74119 | 77.1 | 4 | Tulsa |
| 74063 | 77.0 | 4 | Tulsa |
| 74145 | 76.5 | 4 | Tulsa |
| 74364 | 75.9 | 4 | Delaware |
| 74370 | 74.9 | 4 | Ottawa |
| 74427 | 73.4 | 3 | Cherokee |
| 74469 | 72.5 | 3 | Muskogee |
| 74133 | 71.4 | 3 | Tulsa |
| 74450 | 71.3 | 3 | Muskogee |
| 74845 | 70.7 | 3 | McIntosh |
| 74358 | 69.9 | 3 | Ottawa |
| 74434 | 69.9 | 3 | Muskogee |
| 74330 | 69.8 | 3 | Mayes |
| 74029 | 69.6 | 3 | Washington |
| 74429 | 69.5 | 3 | Wagoner |
| 74015 | 68.7 | 3 | Rogers |
| 74146 | 68.6 | 3 | Tulsa |
| 74428 | 68.4 | 3 | McIntosh |
| 74006 | 68.2 | 3 | Washington |
| 74042 | 68.0 | 3 | Nowata |
| 74363 | 67.7 | 3 | Ottawa |
| 74333 | 67.0 | 3 | Craig |
| 74359 | 66.0 | 3 | Delaware |
| 74455 | 65.8 | 3 | Muskogee |
| 74964 | 63.6 | 3 | Adair |
| 74367 | 62.7 | 3 | Mayes |
| 74332 | 61.9 | 3 | Craig |
| 74027 | 61.7 | 3 | Nowata |
| 74338 | 61.1 | 3 | Delaware |
| 74036 | 58.7 | 2 | Rogers |
| 74436 | 58.7 | 2 | Muskogee |
| 74055 | 57.5 | 2 | Tulsa |
| 74104 | 56.5 | 2 | Tulsa |
| 74931 | 56.2 | 2 | Adair |
| 74019 | 54.5 | 2 | Rogers |
| 74134 | 53.8 | 2 | Tulsa |
| 74012 | 53.4 | 2 | Tulsa |
| 74423 | 52.5 | 2 | Muskogee |
| 74072 | 51.4 | 2 | Nowata |
| 74369 | 51.4 | 2 | Craig |
| 74014 | 49.3 | 2 | Wagoner |
| 74011 | 49.2 | 2 | Tulsa |
| 74073 | 48.7 | 2 | Tulsa |
| 74021 | 48.2 | 2 | Tulsa |
| 74471 | 48.0 | 2 | Cherokee |
| 74936 | 46.9 | 2 | Sequoyah |
| 74954 | 46.8 | 2 | Sequoyah |
| 74120 | 44.6 | 2 | Tulsa |
| 74053 | 39.1 | 1 | Rogers |
| 74114 | 39.0 | 1 | Tulsa |
| 74008 | 38.5 | 1 | Tulsa |
| 74061 | 37.3 | 1 | Washington |
| 74137 | 36.5 | 1 | Tulsa |
| 74037 | 35.8 | 1 | Tulsa |
| 74022 | 35.1 | 1 | Washington |
| 74051 | 33.0 | 1 | Washington |
| 74463 | 32.0 | 1 | Muskogee |
| 74080 | 26.0 | 1 | Rogers |
| 74132 | 25.6 | 1 | Tulsa |
| 74033 | 23.3 | 1 | Tulsa |
| 74083 | 9.6 | 1 | Nowata |
Data Source
The Mental Health Index is calculated by Conduent Healthy Communities Institute using data from Claritas, 2023; American Community Survey, 2017-2021; and CDC PLACES Project, 2020.
Technical Note
Index values are not comparable across measurement periods. Index values and rankings are specific to a measurement period, showing the relative ranking of a location in comparison to other similar locations at that time.