
Indicator Gauge Icon Legend
Legend Colors
Red is bad, green is good, blue is not statistically different/neutral.
Compared to Distribution
 the value is in the best half of communities.
 the value is in the 2nd worst quarter of communities.
 the value is in the worst quarter of communities.
Compared to Target
 meets target;
  does not meet target.
Compared to a Single Value
 lower than the comparison value;
 higher than the comparison value;
 not statistically different from comparison value.
Trend

 non-significant change over time;
 significant change over time;
  no change over time.
Compared to Prior Value
 higher than the previous measurement period;
 lower than the previous measurement period;
 no statistically different change from previous measurement period.
 Significantly better than the overall value
 Significantly worse than the overall value
 No significant difference with the overall value
 No data on significance available
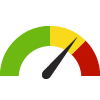
Adults who Drank Soft Drinks: Past 7 Days
County: Ottawa
This indicator is archived and is no longer being updated. Click to learn more
This indicator shows the percentage of adults who consumed regular soft drinks in the past 7 days. Diet soft drinks are excluded.
Why is this important?
Regular (i.e., non-diet) soft drinks have large amounts of added sugar, lack nutritional value, and are great calorie contributors in diets. The consumption of soft drinks is associated with weight gain and obesity. Reducing soft drink consumption can result in a decrease in weight and is an important element of obesity prevention. The U.S. Department of Health and Human Services and the U.S. Department of Agriculture recommend limiting daily consumption of the added sugars found in all sweetened beverages to no more than 10 percent of calories per day.
Clear this location
49.2%
Source:
Claritas Consumer Profiles
Measurement period: 2023
Maintained by: Conduent Healthy Communities Institute
Last update: February 2024
Measurement period: 2023
Maintained by: Conduent Healthy Communities Institute
Last update: February 2024
Filter(s) for this location: State: Oklahoma
Compared to


| County | Source | Measurement Period | Percent | |
|---|---|---|---|---|
There are 14 County values. The lowest value is 45.5%, and the highest value is 51.5%.
Half of the values are between 45.7% and 49.3%.
The middle (median) value is 48.3%.
Data Source
- Claritas Consumer Profiles
Maintained By: Conduent Healthy Communities Institute (Methodology)
Filed under: Health / Nutrition & Healthy Eating, Health Behaviors, Adults